1982issue C071-9
Evaluating half-hour crossovers with cycle priors and stops
A historical half-hour design treated a moving-average crossover as a locked long-or-short hypothesis. A Fourier scan nominated the average lengths, the flip rule stayed fixed, and a one-percent stop was then asked whether leftover event risk still broke the bound.
- The oscillator is the difference between a short and a long moving average of closes, and the stance stays always in the market until the opposite cross.
- Fourier analysis of half-hour prices nominated moving-average lengths and was not used as a standalone trade signal.
- A one-percent stop-loss bound was part of the design, and Friday afternoon money-supply releases produced adverse moves larger than that bound.
- Editorial: the evaluation keeps the flip rule fixed and asks the cycle prior and the stop to do separate jobs.
A locked long-or-short hypothesis
Editorial framing: evaluate the crossover as a locked long-or-short hypothesis. Let a cycle scan nominate average lengths, keep the flip rule fixed, and then ask whether a pre-declared stop still contains leftover event risk. The paragraphs that follow record the historical workflow only.
The always-in-market flip rule
The oscillator is the difference between a short and a long moving average of closes. A long signal is the short average crossing above the long average, and a short signal is the reverse cross.
The rule stays continuously long or short. It is always in the market and reverses only when the short average violates the long-average trend.
Half-hour bars from ten-second quotes
Quotes taken every ten seconds were grouped into half-hour high-low-close bars. The session ran from 9:00 a.m. to 3:15 p.m. Central Time and produced thirteen bars, with the final fifteen minutes treated as one bar.
The same half-hour design was applied to S&P 500 and Value Line futures over 31 May 1983 through 19 August 1983.
Cycle peaks as length priors
A Fourier scan of the half-hour series listed candidate cycles at 16, 17, 18, 25, 32, 36, 42, 51, and 64 periods. A later fast-Fourier pass on the Value Line series placed a major peak at 29.26 periods and a secondary peak at 64 periods.
Average lengths were then set near half the indicated cycle, focusing a 14-to-20-period search band on the Value Line series. Fourier peaks were used as starting values for moving-average lengths rather than as standalone trade signals.
A one-percent stop and leftover event risk
The test design included a one-percent stop-loss bound applied while the crossover position remained open.
Holding through Friday afternoon money-supply releases produced adverse moves larger than that bound.
Value Line Profit Matrix: long, short, and net P&L by line item
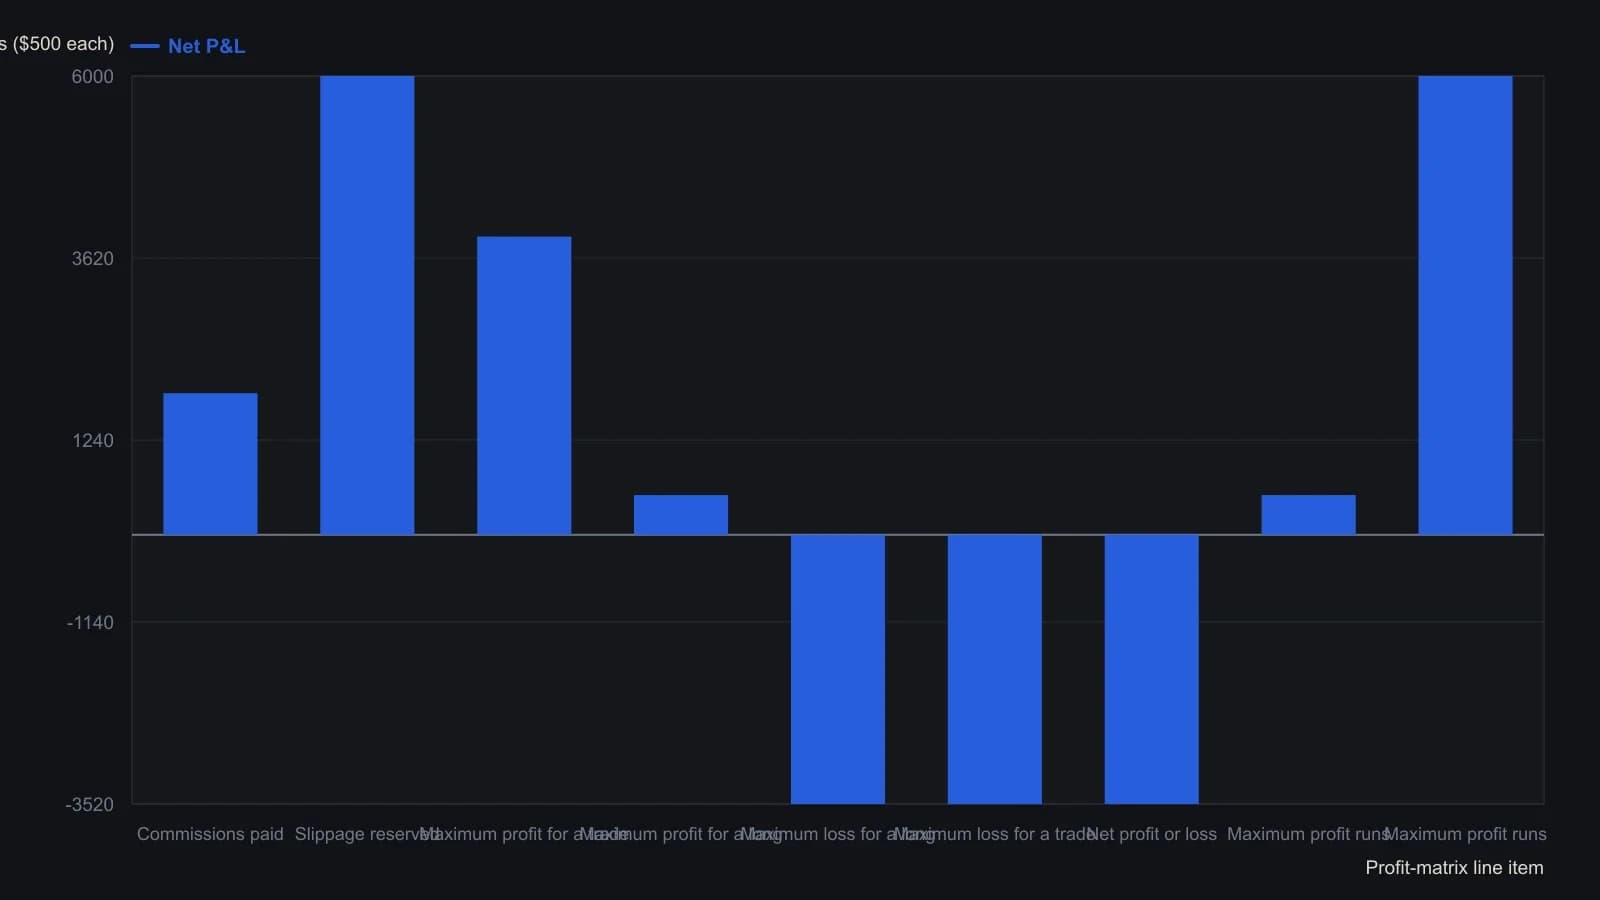
One point equals $500. The system stayed through Friday money-supply prints; several losses exceeded the declared 1 percent stop.
All readings on this track · 26 readings
- 1982Critiquing Fourier, Elliott, and seasonal commodity models
- 1982Evaluating half-hour crossovers with cycle priors and stops
- 1984Building moving-window spectral cycle forecasts
- 1988Fourier cycles versus calendar seasonal regimes
- 1989Constructing analog cycle signatures from price lows
- 1990Curve fits fail the forecast test
- 1991Auditing moving-average length with Fourier spectra
- 1991Closed-form phase for dominant-cycle spectra
- 1993Evaluating windowed spectral forecasts of index turning points
- 1994Window length for moving-window spectral forecasts
- 1994Constructing WAMI power and phase spectra
- 1994Fourier-tuned momentum filter design
- 1994Aliasing, leakage, and dominant-cycle reads from sampled prices
- 1995Constructing indicator lookbacks from Fourier spectra
- 1996Constructing phase from a dominant-cycle sine and cosine pair
- 1999Sinusoidal pseudo-securities for indicator evaluation
- 2000Constructing dominant cycle length from Hilbert phase
- 2000Constructing adaptive channel breakouts from a measured cycle period
- 2005Embedding forex prices into a singular-spectrum forecast basis
- 2005Constructing recurrent forecasts from grouped spectral components
- 2007Constructing a dominant cycle from transformed Fourier spectra
- 2010Why cycle indicators fail when parameters shift
- 2019Constructing futures momentum as open-interest-scaled rate of change
- 2019Judging a dominant cycle and a trend filter by sample, lag and the move they keep
- 2020Constructing futures turnover time and urgency
- 2020Stock power ratio as a growth trend filter