1991issue C031-5
Auditing moving-average length with Fourier spectra
Fourier analysis is presented as a way to inspect cyclical content and to choose trend-following indicator lengths, while its forecasting use is described as limited. Editorial interpretation: require regular, unsmeared valleys before naming a dominant cycle, then convert that length to a half-cycle average and judge the smoother on the price path.
- Fourier analysis is presented as a way to inspect cyclical content and to choose trend-following indicator lengths. Its forecasting use is described as limited.
- Valleys between spectral peaks are treated as cutoff frequencies chosen by eye. A half-cycle average is described as removing cyclical content shorter than that cutoff.
- After a cycle length is read from the spectrum, the prescribed check is to halve it, plot the average on the price bars, and allow small adjustments, including different lengths in rising and falling markets.
- Fourier analysis is described as more useful on long-term series, while maximum-entropy methods are preferred for short-term cyclic structure.
Inspect cyclical content, then choose a length
Fourier analysis of a price series is presented as a way to inspect cyclical content and to choose lengths for trend-following indicators. The method decomposes an ordered price series into amplitude-by-frequency components so that cyclical content can be inspected. Forecasting use of the same decomposition is described as limited.
Cutoff valleys and the half-cycle average
Spectral analysis reads amplitude-versus-frequency structure to judge how regular, sharp, or smeared cyclical components are. Valleys between spectral peaks are treated as cutoff frequencies chosen by eye. A cutoff frequency is a valley chosen between peaks. Cycles shorter than that valley are the content a half-cycle average is meant to suppress.
A half-cycle average is a moving average whose lookback is half an identified cycle length, used as a candidate trend filter. That average is described as removing cyclical content shorter than the cutoff. The step detrends shorter cyclical swings so a longer trend line can be judged against turning points. Spectral smear is broad, poorly separated energy on the amplitude-frequency chart. It is treated as weak evidence for a usable cycle length.
Regular spectra versus smeared spectra
An amplitude-versus-frequency chart of December Euro prices is described as showing relatively regular peak and valley spacing, even though the listed cycle lengths were not exact half-length harmonics. In that Euro example, a short half-cycle average at one marked cutoff is described as eliminating cyclical content from nearby shorter cycles. Longer Euro averages are described as close to the spectral lengths, while a shorter component is called weak relative to a much longer cycle and smeared against a nearby cycle.
Daily December Treasury-bond spectra show less regularity than the Euro case. A short cycle remains visible, while a longer listed feature appears only near a neighboring length. Weekly bond spectra are described as roughly matching the daily cycle lengths at the earliest marked points, with a weaker inflection at a longer length.
An S&P amplitude-frequency chart is described as having sharply defined valleys. Deutschemark and crude-oil charts are described as smeared, with little structure beyond the first peaks.
S&P cutoff valleys and half-cycle lengths
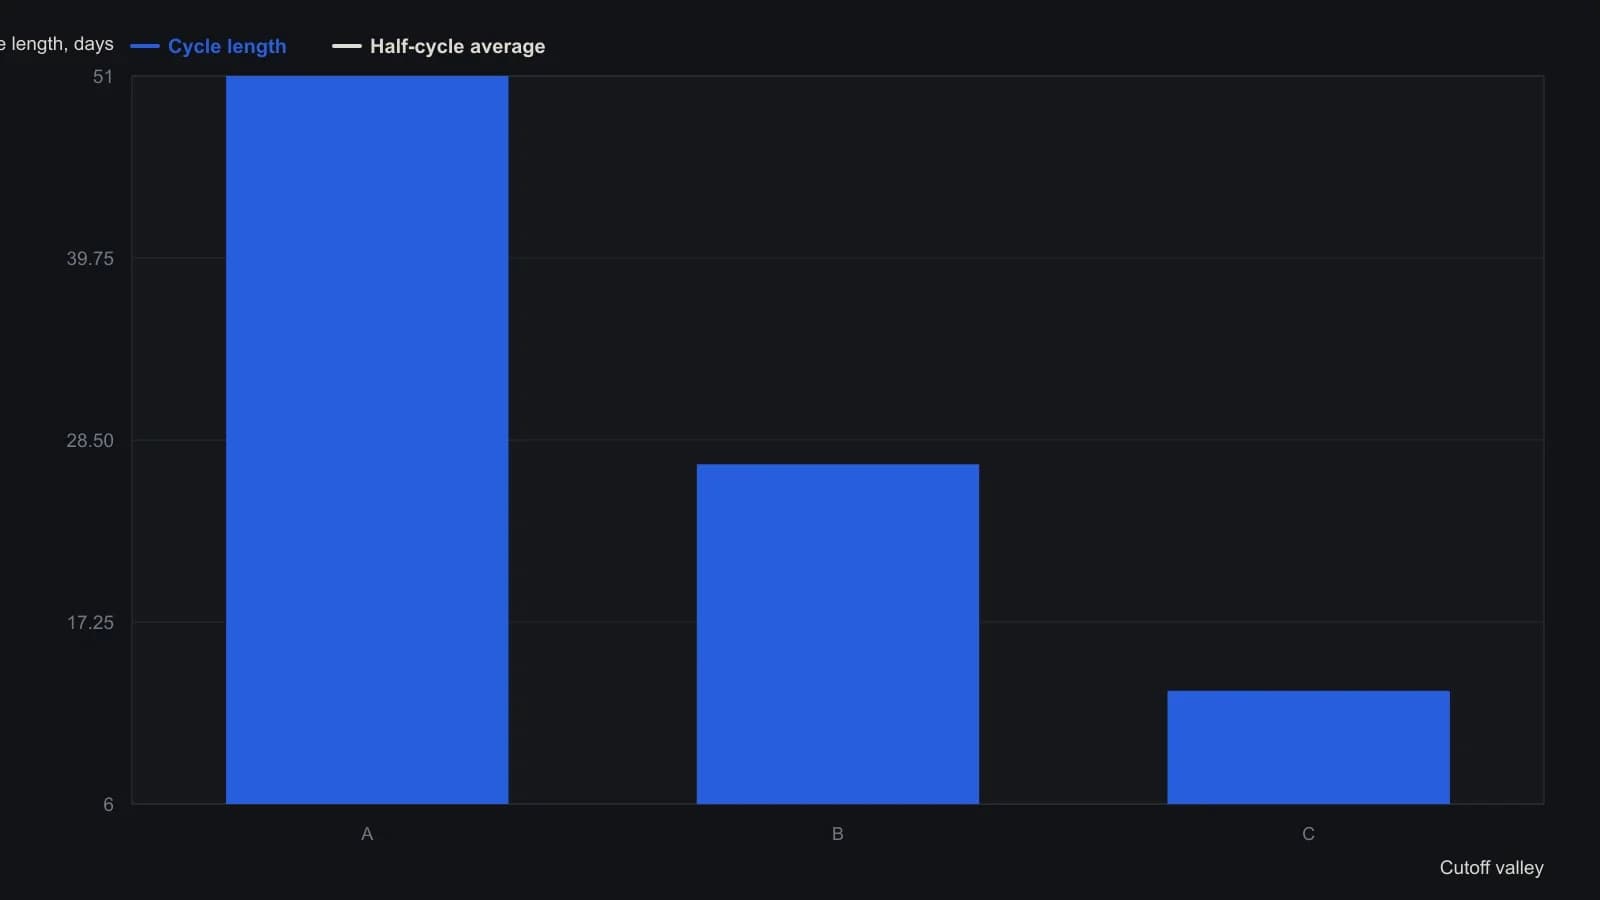
Cutoff valleys were eyeballed between spectral peaks, so the printed lengths already include that discretion. Body text lists C as 13 days; the figure caption says 12. The table on the figure is 13 / half-cycle 6.
Judge the smoother on the price path
A dominant cycle is a comparatively prominent spectral peak whose length may inform a smoother or filter. After cycle lengths are read from the spectrum, the prescribed check is to halve those lengths, plot the resulting averages on the price bars, and allow small adjustments of a few periods, including different lengths in rising and falling markets.
Long-term series and short-term structure
Fourier analysis is described as more useful on long-term series, while maximum-entropy methods are preferred for short-term cyclic structure.
All readings on this track · 26 readings
- 1982Critiquing Fourier, Elliott, and seasonal commodity models
- 1982Evaluating half-hour crossovers with cycle priors and stops
- 1984Building moving-window spectral cycle forecasts
- 1988Fourier cycles versus calendar seasonal regimes
- 1989Constructing analog cycle signatures from price lows
- 1990Curve fits fail the forecast test
- 1991Auditing moving-average length with Fourier spectra
- 1991Closed-form phase for dominant-cycle spectra
- 1993Evaluating windowed spectral forecasts of index turning points
- 1994Window length for moving-window spectral forecasts
- 1994Constructing WAMI power and phase spectra
- 1994Fourier-tuned momentum filter design
- 1994Aliasing, leakage, and dominant-cycle reads from sampled prices
- 1995Constructing indicator lookbacks from Fourier spectra
- 1996Constructing phase from a dominant-cycle sine and cosine pair
- 1999Sinusoidal pseudo-securities for indicator evaluation
- 2000Constructing dominant cycle length from Hilbert phase
- 2000Constructing adaptive channel breakouts from a measured cycle period
- 2005Embedding forex prices into a singular-spectrum forecast basis
- 2005Constructing recurrent forecasts from grouped spectral components
- 2007Constructing a dominant cycle from transformed Fourier spectra
- 2010Why cycle indicators fail when parameters shift
- 2019Constructing futures momentum as open-interest-scaled rate of change
- 2019Judging a dominant cycle and a trend filter by sample, lag and the move they keep
- 2020Constructing futures turnover time and urgency
- 2020Stock power ratio as a growth trend filter