2019issue C0416-19
Constructing futures momentum as open-interest-scaled rate of change
A historical workflow isolates a week-scale futures price wave with a Fourier low-pass, takes that smoothed path's rate of change, and scales the velocity by total open interest so momentum is a signed dollars-per-day transfer of funds.
- Minute-to-day discovery prints are treated as noise that samples nearby bid and ask intensity, while the longer-horizon object is the multi-week to multi-month price oscillation.
- A Fourier low-pass that kept components longer than about 10 days turned 256 nearest-expiry crude-oil closes into a smooth path stated to hold over 98 percent of that series information.
- Total open interest across listed months is defined as market inertia, equal to both the long stock and the short stock, and is used because larger open-interest complexes are described as usually less volatile than thin ones.
- Market momentum is constructed as open interest times contract quantity times the price rate of change, always in dollars per day, and is read as the daily transfer of funds between shorts and longs.
Momentum as a constructed quantity
The historical workflow starts from a slower futures price wave and builds a dollars-per-day momentum series from that wave's rate of change and from total open interest.
Significant multi-week to multi-month price oscillations are separated from minute-to-day discovery fluctuations, which are treated as noise. Those short-term prints are treated as a way to sample nearby bid and ask intensity rather than as the object of a longer-horizon model.
Oscillation versus noise
A Fourier low-pass construction that kept components longer than about 10 days was applied to 256 nearest-expiry crude-oil closes from 22 December 2017 through 28 December 2018 to produce a smooth oscillation path.
The retained low-frequency components were stated to hold over 98 percent of that price series information, with residuals of about plus or minus 1 to 2 dollars per barrel around the smooth path. The unsmoothed closes ranged about 45 to 75 dollars per barrel.
Rate of change as the motion term
The motion term is the signed daily price velocity taken from that smoothed futures path. Differentiating the low-pass path keeps the rate of change attached to the retained oscillation rather than to minute-to-day discovery noise.
That velocity is then used as the motion term in a constructed momentum quantity, not as a standalone named oscillator.
Open interest as market inertia
Total open interest across listed months is defined as market inertia equal to both the long stock and the short stock. It is paired with total volume as a less noisy participation measure than a single expiry.
In the 2018 crude-oil window, smoothed total open interest averaged about 2 to 2.5 million contracts and volume about 1 to 1.5 million trades a day. A 1-dollar move on 1,000-barrel contracts was illustrated as transferring about 1.2 billion dollars between longs and shorts.
Larger open-interest complexes such as crude oil and Treasury bills are described as usually less volatile than thin complexes such as pork bellies or orange juice, which is why open interest is used as the inertia term.
Market momentum in dollars per day
Market momentum is constructed as q = N Q dp/dt, always in dollars per day. It is identified with the daily transfer of funds from shorts to longs when price rises and from longs to shorts when price falls.
The same dollars-per-day construction is illustrated with a gold contract: a 0.50-dollar-per-troy-ounce daily change, 100 ounces per contract, and 400,000 open contracts yields 20 million dollars per day.
On the crude-oil example, differentiating the Fourier-smoothed price path and multiplying by smoothed open interest produced a signed momentum series that reversed on a cycle of roughly 20 days and reached on the order of a billion dollars per day.
Crude-oil momentum as dollars-per-day fund flow
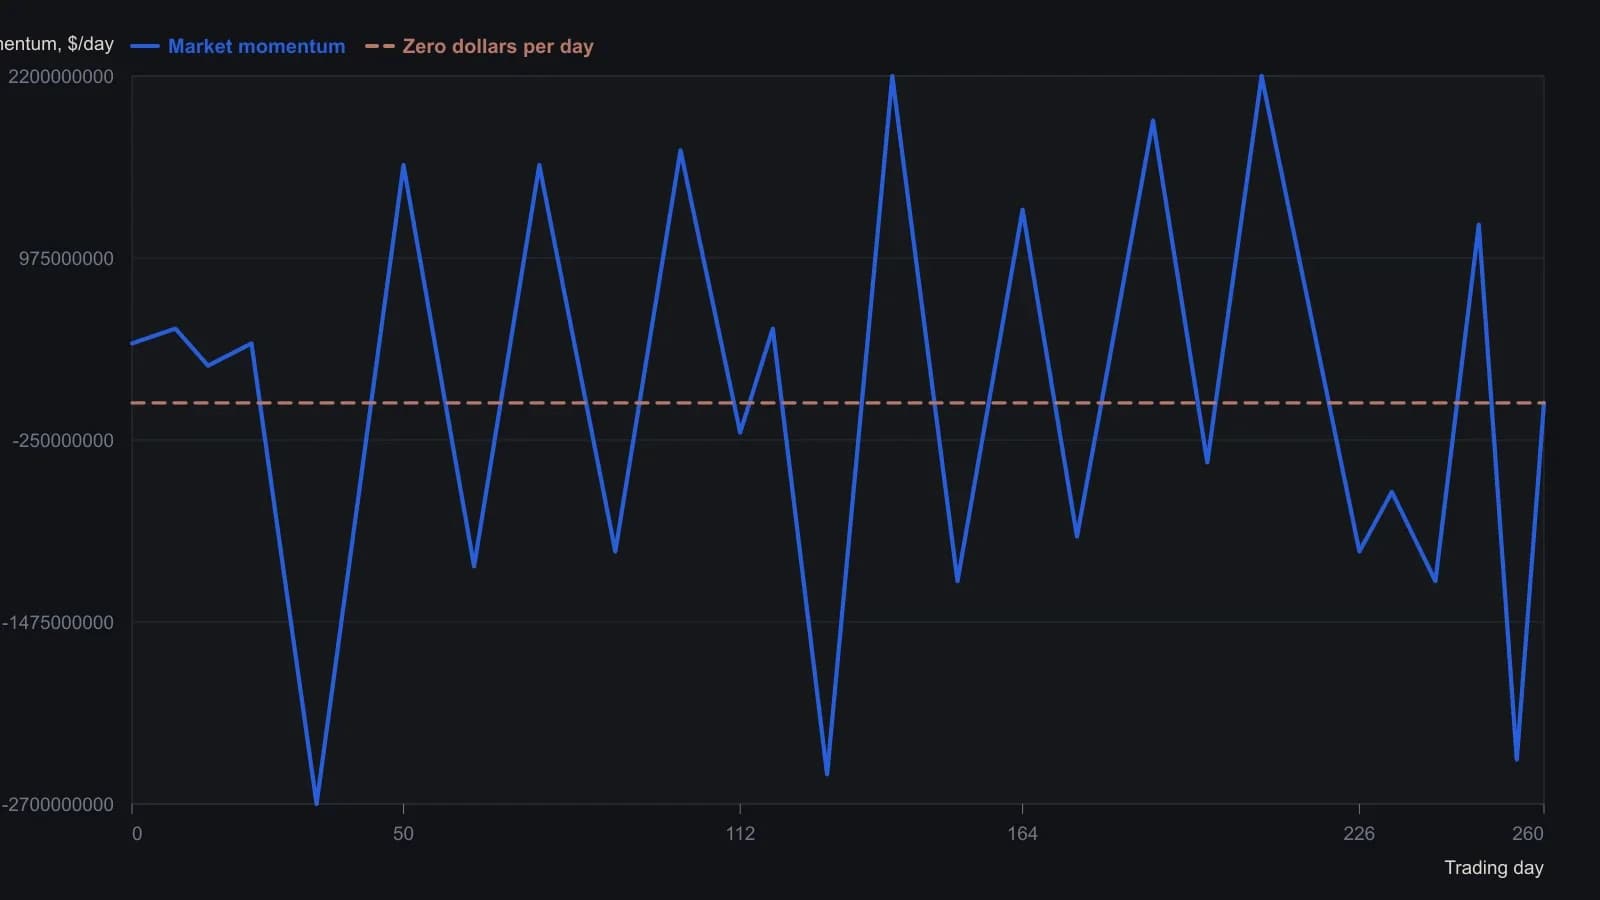
Low-pass cutoff keeps oscillations longer than about 10 days on a 256-session nearest-contract composite from 22 December 2017 to 28 December 2018. Open interest is the total across all listed months. Vertical readings follow the published ±3×10^9 $/day scale and cannot be more precise than the raster allows.
All readings on this track · 26 readings
- 1982Critiquing Fourier, Elliott, and seasonal commodity models
- 1982Evaluating half-hour crossovers with cycle priors and stops
- 1984Building moving-window spectral cycle forecasts
- 1988Fourier cycles versus calendar seasonal regimes
- 1989Constructing analog cycle signatures from price lows
- 1990Curve fits fail the forecast test
- 1991Auditing moving-average length with Fourier spectra
- 1991Closed-form phase for dominant-cycle spectra
- 1993Evaluating windowed spectral forecasts of index turning points
- 1994Window length for moving-window spectral forecasts
- 1994Constructing WAMI power and phase spectra
- 1994Fourier-tuned momentum filter design
- 1994Aliasing, leakage, and dominant-cycle reads from sampled prices
- 1995Constructing indicator lookbacks from Fourier spectra
- 1996Constructing phase from a dominant-cycle sine and cosine pair
- 1999Sinusoidal pseudo-securities for indicator evaluation
- 2000Constructing dominant cycle length from Hilbert phase
- 2000Constructing adaptive channel breakouts from a measured cycle period
- 2005Embedding forex prices into a singular-spectrum forecast basis
- 2005Constructing recurrent forecasts from grouped spectral components
- 2007Constructing a dominant cycle from transformed Fourier spectra
- 2010Why cycle indicators fail when parameters shift
- 2019Constructing futures momentum as open-interest-scaled rate of change
- 2019Judging a dominant cycle and a trend filter by sample, lag and the move they keep
- 2020Constructing futures turnover time and urgency
- 2020Stock power ratio as a growth trend filter