2010issue C0442-49
Why cycle indicators fail when parameters shift
A deterministic signal-processing model of price is a teaching simplification used to split a series into a constant, a trend, cyclical components, and noise. Fourier analysis and Spectral analysis can estimate cycle content in ordered prices, but those estimates remain historically contingent when the filter settings change.
- A deterministic signal-processing model of price is a teaching simplification, not a claim that markets are accurately described as non-random.
- Price can be decomposed into a constant, a trend, cyclical components, and noise so that an indicator is judged by which term it tries to isolate.
- Fourier analysis and Spectral analysis can estimate cycle content in ordered price series, but those estimates are historically contingent rather than guaranteed forecasts.
- Editorial view: treat Dominant cycle detection and related cycle indicators as parameter-sensitive filters, not as proof that markets contain a stable, tradable rhythm.
A teaching simplification
A deterministic signal-processing model of price is a teaching simplification. It is not a claim that markets are accurately described as non-random.
The historical workflow decomposes price into a constant, a trend, cyclical components, and noise. Once those terms are named, an indicator can be judged by which term it tries to isolate.
S&P 500 daily prices used to introduce the signal model
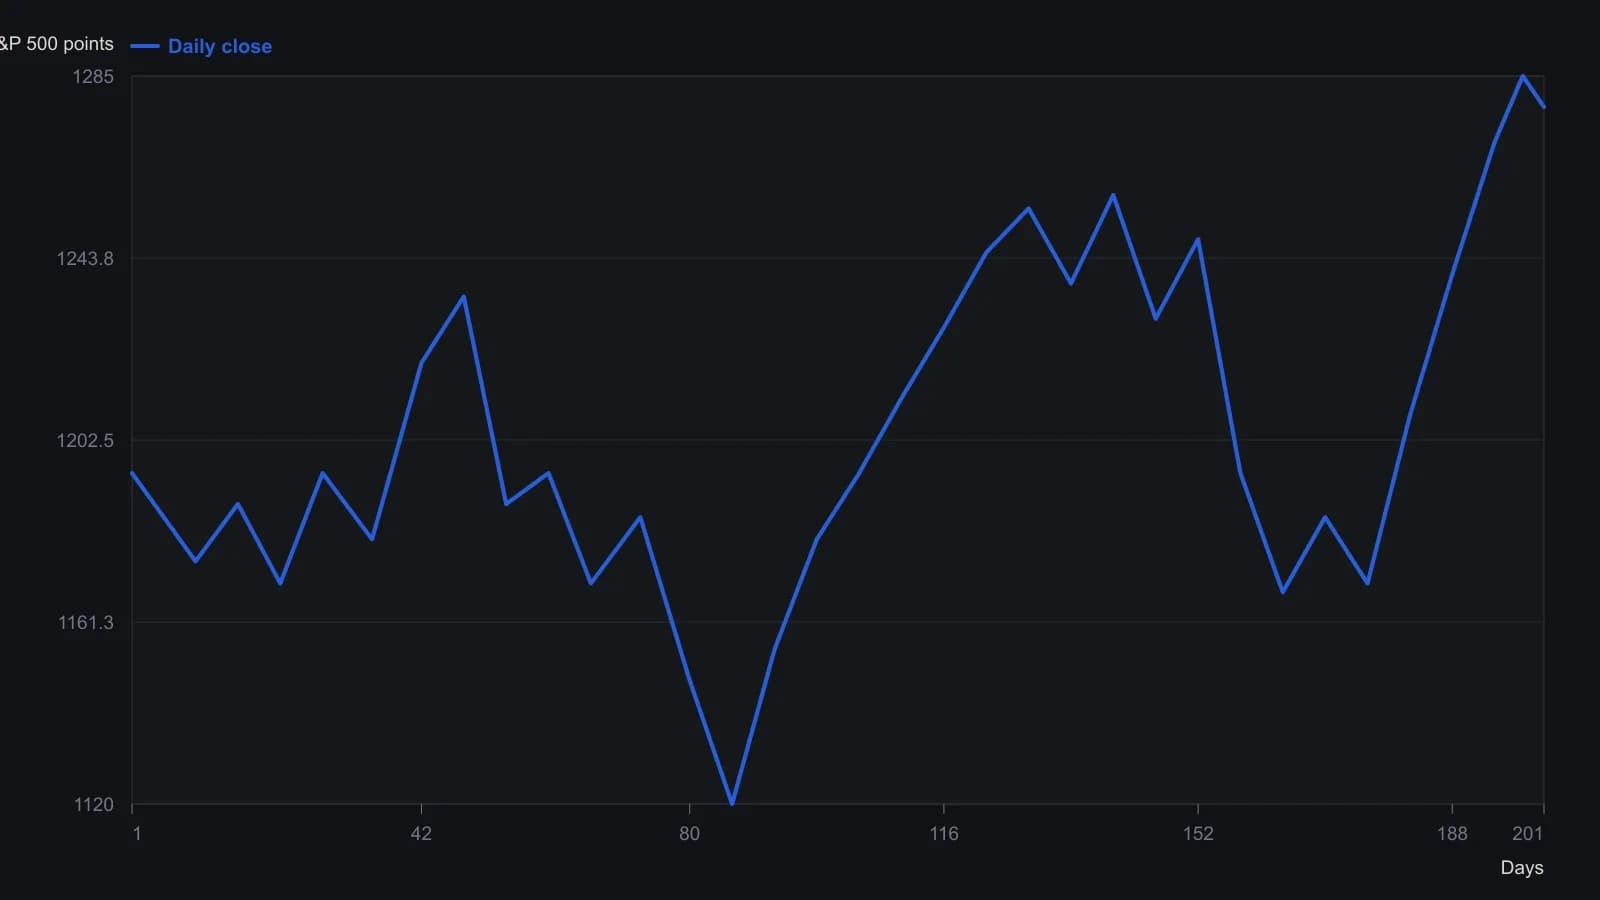
The source figure is an OHLC bar chart; only approximate closes are recovered. Vertical labels 1100, 1150, 1200, 1250, 1300 and horizontal labels 1, 51, 101, 151, 201 come from the article. Values are rounded to five index points because the raster cannot support finer precision.
What the estimates can show
Fourier analysis and Spectral analysis can estimate cycle content in an ordered price series. Dominant cycle detection then names a prevailing cyclical component from that estimate.
The archive treats those estimates as historically contingent rather than as guaranteed forecasts. They describe ordered observations under a chosen decomposition. They do not, by themselves, show that a durable rhythm has been found.
Keep the forecast in context
A readout from Dominant cycle detection, Fourier analysis, or Spectral analysis should be read as a historically contingent description of past ordered observations. It is not a guaranteed forecast.
That reading keeps the deterministic model in its proper place: a teaching aid for judging which term a tool tries to isolate, not a claim that price is accurately non-random.
All readings on this track · 26 readings
- 1982Critiquing Fourier, Elliott, and seasonal commodity models
- 1982Evaluating half-hour crossovers with cycle priors and stops
- 1984Building moving-window spectral cycle forecasts
- 1988Fourier cycles versus calendar seasonal regimes
- 1989Constructing analog cycle signatures from price lows
- 1990Curve fits fail the forecast test
- 1991Auditing moving-average length with Fourier spectra
- 1991Closed-form phase for dominant-cycle spectra
- 1993Evaluating windowed spectral forecasts of index turning points
- 1994Window length for moving-window spectral forecasts
- 1994Constructing WAMI power and phase spectra
- 1994Fourier-tuned momentum filter design
- 1994Aliasing, leakage, and dominant-cycle reads from sampled prices
- 1995Constructing indicator lookbacks from Fourier spectra
- 1996Constructing phase from a dominant-cycle sine and cosine pair
- 1999Sinusoidal pseudo-securities for indicator evaluation
- 2000Constructing dominant cycle length from Hilbert phase
- 2000Constructing adaptive channel breakouts from a measured cycle period
- 2005Embedding forex prices into a singular-spectrum forecast basis
- 2005Constructing recurrent forecasts from grouped spectral components
- 2007Constructing a dominant cycle from transformed Fourier spectra
- 2010Why cycle indicators fail when parameters shift
- 2019Constructing futures momentum as open-interest-scaled rate of change
- 2019Judging a dominant cycle and a trend filter by sample, lag and the move they keep
- 2020Constructing futures turnover time and urgency
- 2020Stock power ratio as a growth trend filter