1999issue C081-8
Sinusoidal pseudo-securities for indicator evaluation
A constructed sine-wave series with a known future path lets a moving average be scored as a baseline filter, and it lets an ideal trend filter be judged by whether cyclic components recombine to match the original wave.
- A sinusoidal pseudo-security is a constructed price series built from one or more sine waves and imported as a controlled series whose future path is already known.
- On these known series, a moving average can be scored as a baseline filter by comparing its output with the wave that will actually continue.
- An ideal trend filter would split a series into a few cyclic components and recombine them so the reconstructed wave matches the original before any projection.
- Because real cycles do not keep constant period, frequency, or amplitude, results on stationary sinusoids illustrate filter mechanics and do not transfer as live-market forecasts.
A controlled series with a known future
A sinusoidal-pseudo-security is a synthetic series built from one or more sine waves with chosen amplitude, period, and phase. It is a form of pseudo-security: a constructed price series whose future path is known, used only to test how an indicator or filter behaves.
A single sinusoid can be generated from a closed-form amplitude-sine formula and imported as a controlled series for indicator tests. Composite sinusoidal series are formed by adding multiple copies of that same sine formula with independent amplitude, period, and phase.
Price as overlapping cycles
Frequency-domain-analysis studies price as overlapping cycles of different period and amplitude rather than as a straight line versus time. The observed series is treated as a complex-price-wave: the sum of several cyclic components with different frequencies and amplitudes.
First 13 closes of the three-sine pseudo-security
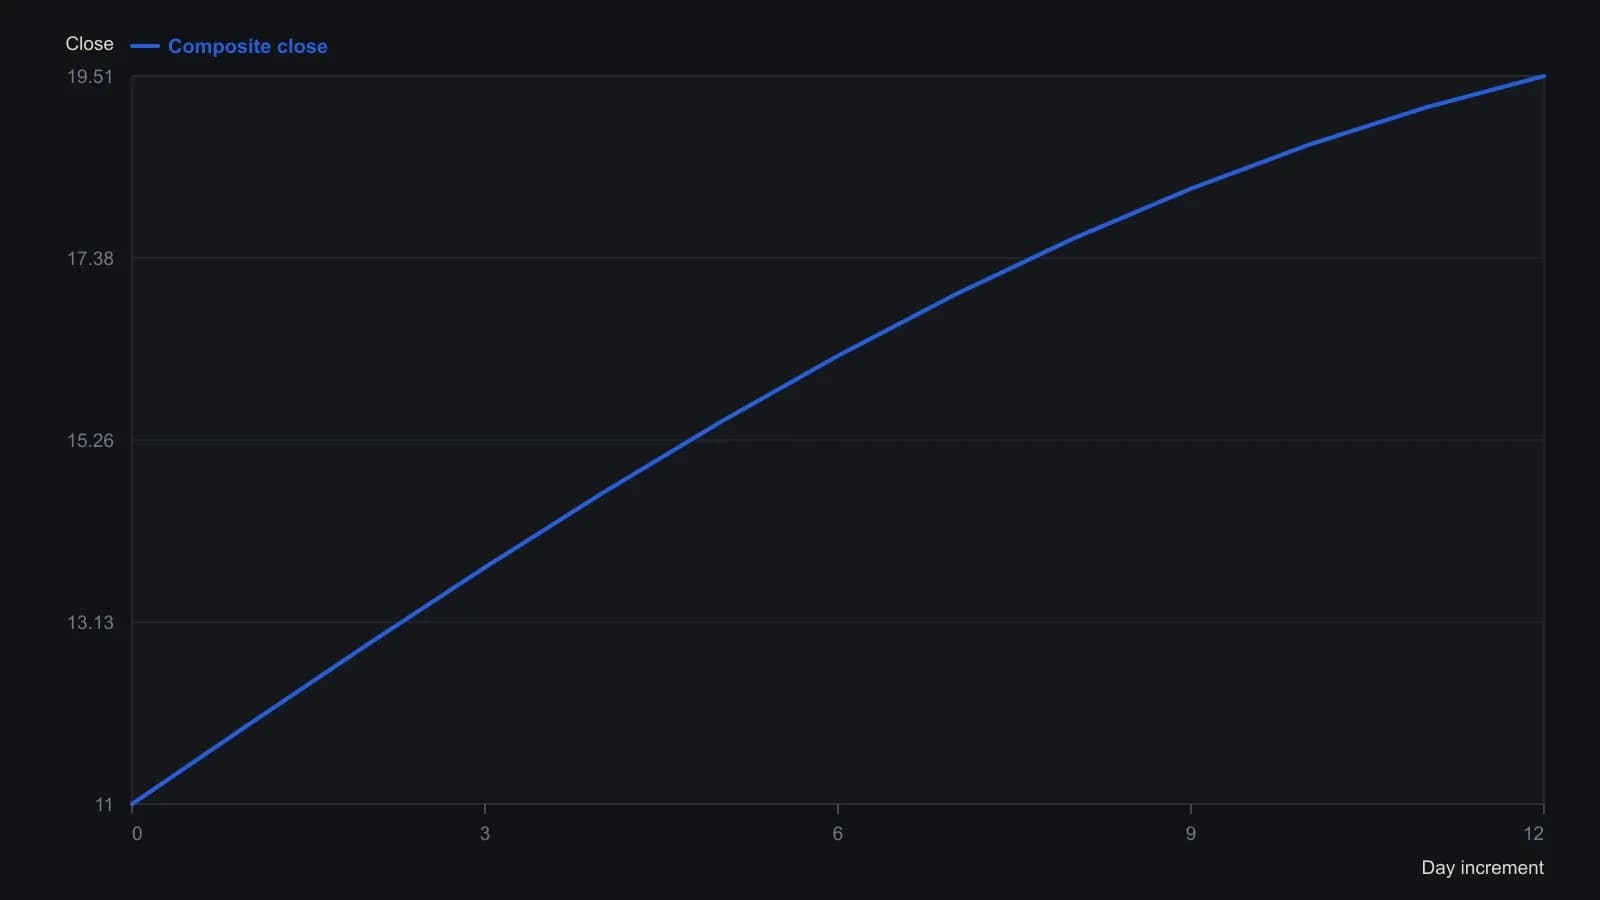
Parameters in F2:H5 are bias 11, long 9 at 210 days, medium 5 at 95 days, short 2 at 37 days, all phases 0. The sine argument is the DAY index. VALUE matches that formula; the CLOSE cell on day 1 in the screenshot (12.86) does not.
A moving average as a baseline filter
On these known series, a moving average can be scored as a baseline filter by comparing its output with the wave that will actually continue, because future values are already specified. A lone sinusoid is enough to expose basic response and lag properties of moving averages and of moving-average-convergence tools before multi-cycle cases are introduced.
The same controlled comparison shows a moving average is not an ideal cycle-separation tool, so other candidate filters remain worth testing under identical conditions. Filter-imperfection is lag, leakage, or other distortion that makes an indicator misrepresent the cycle that produced its output.
Recombination before any projection
An ideal trend filter would split a price series into a few cyclic components and recombine them so the reconstructed wave matches the original before any projection. Fourier analysis is the separation of a composite price wave into sinusoidal components that can later be recombined or projected. A trend filter is meant to isolate a lower-frequency directional component from higher-frequency cyclic variation.
What stationary sinusoids do not transfer
Because real cycles do not keep constant period, frequency, or amplitude, results on stationary sinusoids illustrate filter mechanics and do not transfer as live-market forecasts.
All readings on this track · 26 readings
- 1982Critiquing Fourier, Elliott, and seasonal commodity models
- 1982Evaluating half-hour crossovers with cycle priors and stops
- 1984Building moving-window spectral cycle forecasts
- 1988Fourier cycles versus calendar seasonal regimes
- 1989Constructing analog cycle signatures from price lows
- 1990Curve fits fail the forecast test
- 1991Auditing moving-average length with Fourier spectra
- 1991Closed-form phase for dominant-cycle spectra
- 1993Evaluating windowed spectral forecasts of index turning points
- 1994Window length for moving-window spectral forecasts
- 1994Constructing WAMI power and phase spectra
- 1994Fourier-tuned momentum filter design
- 1994Aliasing, leakage, and dominant-cycle reads from sampled prices
- 1995Constructing indicator lookbacks from Fourier spectra
- 1996Constructing phase from a dominant-cycle sine and cosine pair
- 1999Sinusoidal pseudo-securities for indicator evaluation
- 2000Constructing dominant cycle length from Hilbert phase
- 2000Constructing adaptive channel breakouts from a measured cycle period
- 2005Embedding forex prices into a singular-spectrum forecast basis
- 2005Constructing recurrent forecasts from grouped spectral components
- 2007Constructing a dominant cycle from transformed Fourier spectra
- 2010Why cycle indicators fail when parameters shift
- 2019Constructing futures momentum as open-interest-scaled rate of change
- 2019Judging a dominant cycle and a trend filter by sample, lag and the move they keep
- 2020Constructing futures turnover time and urgency
- 2020Stock power ratio as a growth trend filter