1994issue C121-12
Aliasing, leakage, and dominant-cycle reads from sampled prices
Editorial teaching: a dominant-cycle forecast is ready only after the same ordered series is re-read at a coarser sampling interval and after an explicit window and detrending choice, so a Fourier peak can be judged as a stable rhythm rather than a sampling artifact.
- Sampling daily or weekly closes instead of every trade can relocate true high-frequency cycles through aliasing, so a spectral peak from the sampled bars may not match the cycle in the unsampled series.
- A boxcar window leaks because a finite cut spreads each true line into a sinc-like shape that can merge nearby components so their locations cannot be separated.
- A reply reports that daily, four-day, and five-day resampling of the same series left the low-frequency spectrum and the frequencies of the highest-power peaks essentially unchanged.
- Editorial: treat a dominant-cycle forecast as ready only after that coarser re-read and after naming the window and detrending choice.
Sampling can move a cycle
Sampling a price series at daily or weekly closes instead of every trade can relocate true high-frequency cycles through aliasing. A spectral peak taken from the sampled bars may not match the cycle present in the unsampled series.
Because that displacement is data-dependent, one critique treats published weekly frequency-component readings of 7 and 15 degrees, and of 8 and 34 degrees, as incorrect by an unknown amount.
The same critique requires tick-level input, a low-pass anti-alias filter, and only then Fourier analysis or spectral analysis. Analyzing already-decimated closes is described as producing erroneous cycle locations.
A rectangular cut leaks
A rectangular extraction window leaks because multiplying in time is convolution in frequency. That boxcar window spreads each true line into a sinc-like shape. Nearby components can merge so their locations cannot be separated. That spreading is spectral leakage.
Hanning-type tapers are described as leakage controls, not as a device whose purpose is only to drive the segment endpoints to zero.
Re-reading the same series at coarser bars
A reply reports that daily sampling, four-day sampling, and a four-day average-then-resample of a volatile cash-price series left the low-frequency spectrum and the frequencies of the highest-power peaks essentially unchanged.
On a 337-day daily-close series, the Fourier power of interest sat in the lowest quarter of sampled frequencies. Dominant-cycle and trigger-frequency lines at 6 and 18 bins converted to about 11 and 32 degrees per week.
Five-day resampling of that same series produced converted peaks of about 11 and 31 degrees per week. The reply treated this as no material high-frequency aliasing effect and as a smaller concern than the choice of data interval.
Window, detrending, and named lookbacks
The reply states that a Hanning window or similar windowing is essential before Fourier analysis of a non-detrended trending series. After detrending, a Hamming window that weights the ends more may be preferable. Windowing itself merges nearby lines and can make a spectrum look fuzzy even without remote leakage.
A cycle-channel procedure treats an 80-day centered average as the dominant intermediate duration and a 20-day centered average as the immediate cycle, reading a likely reversal when the inner channel meets the outer one.
Coarser FDPM/Fourier re-read, late 1992–April 1994
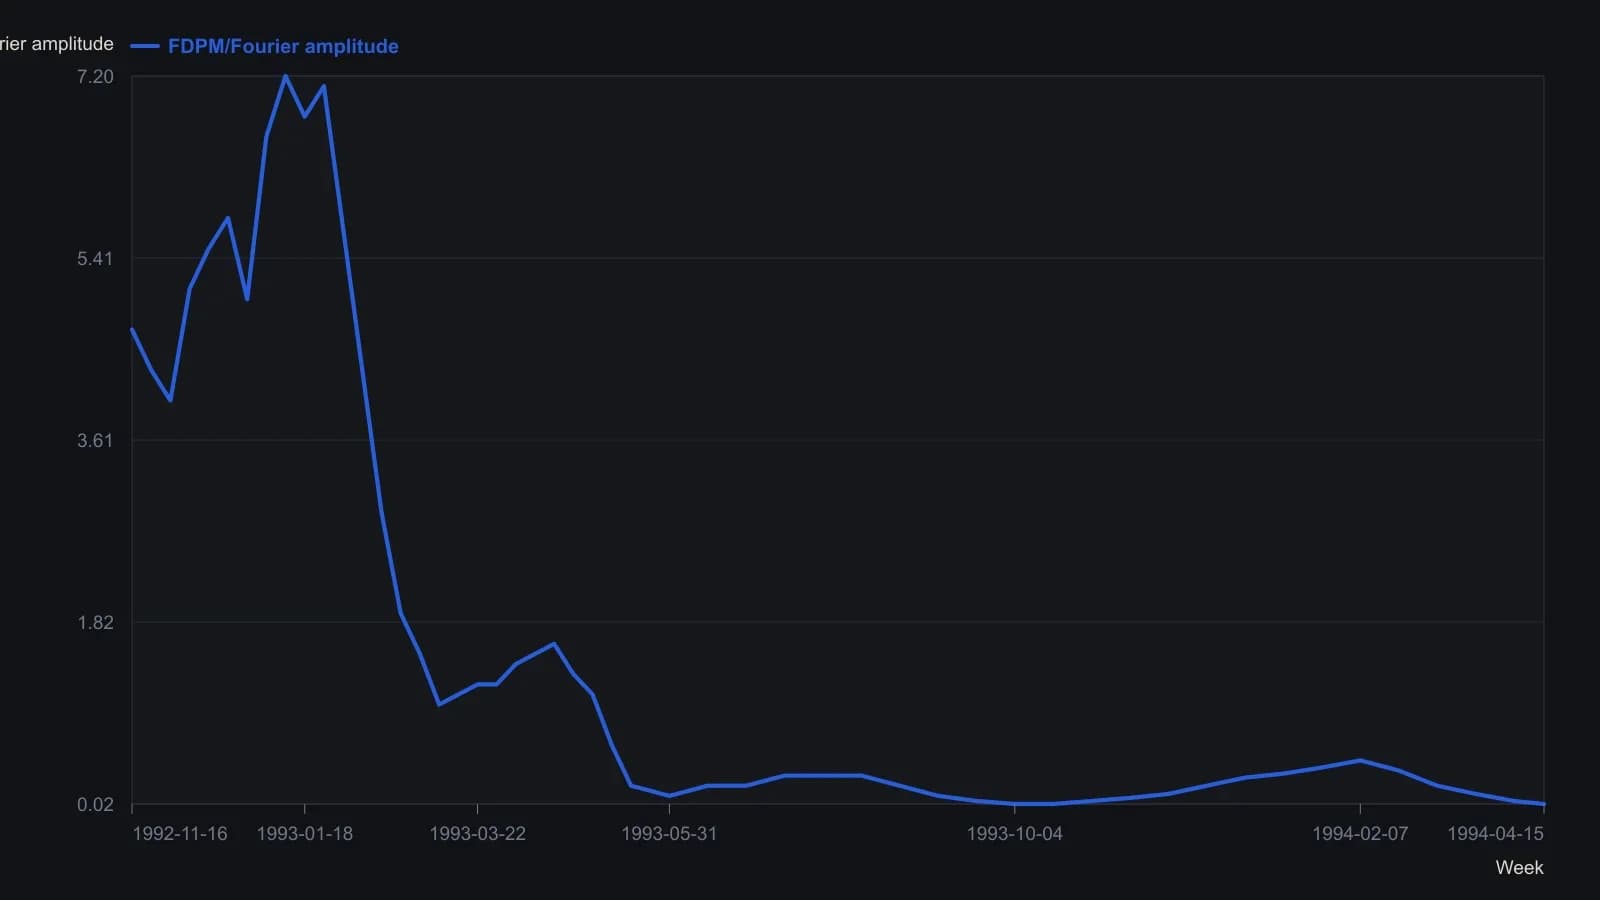
Bar heights are approximate reads against a 1.00 grid. Through May 1993 each weekly bar is resolved; after that the bars sit near the baseline and are sampled at the labeled month ticks rather than invented one by one.
All readings on this track · 26 readings
- 1982Critiquing Fourier, Elliott, and seasonal commodity models
- 1982Evaluating half-hour crossovers with cycle priors and stops
- 1984Building moving-window spectral cycle forecasts
- 1988Fourier cycles versus calendar seasonal regimes
- 1989Constructing analog cycle signatures from price lows
- 1990Curve fits fail the forecast test
- 1991Auditing moving-average length with Fourier spectra
- 1991Closed-form phase for dominant-cycle spectra
- 1993Evaluating windowed spectral forecasts of index turning points
- 1994Window length for moving-window spectral forecasts
- 1994Constructing WAMI power and phase spectra
- 1994Fourier-tuned momentum filter design
- 1994Aliasing, leakage, and dominant-cycle reads from sampled prices
- 1995Constructing indicator lookbacks from Fourier spectra
- 1996Constructing phase from a dominant-cycle sine and cosine pair
- 1999Sinusoidal pseudo-securities for indicator evaluation
- 2000Constructing dominant cycle length from Hilbert phase
- 2000Constructing adaptive channel breakouts from a measured cycle period
- 2005Embedding forex prices into a singular-spectrum forecast basis
- 2005Constructing recurrent forecasts from grouped spectral components
- 2007Constructing a dominant cycle from transformed Fourier spectra
- 2010Why cycle indicators fail when parameters shift
- 2019Constructing futures momentum as open-interest-scaled rate of change
- 2019Judging a dominant cycle and a trend filter by sample, lag and the move they keep
- 2020Constructing futures turnover time and urgency
- 2020Stock power ratio as a growth trend filter