1994issue C111-9
Evaluating eight-year election regimes
The same 80 annual index returns were mapped into four and eight election-relative year-types. A phase-shift of the bars and shuffle-baseline checks of consistency and contrast are what decide whether that calendar map earns a regime slot around one position.
- Eighty annual index returns from 1912 through 1992 were grouped into four election-relative year-types across 20 complete cycles, and the same series was also sorted into eight year-types.
- Charting the four-slot sequence twice was presented as a repeating step-down from the pre-election slot through the mid-term slot, while the eight-slot view followed that sequence only in the first four year-types and showed a wider spread of averages.
- Four stated limits apply: the patterns describe only the past, a year-type average conceals a wide distribution, any dataset can form a visible pattern, and a phase-shift can change the interpretation.
- Against two shuffle-baselines, the four-slot grouping was slightly less consistent than chance and well below chance on contrast. The eight-slot tests stayed too close to the random samples for a firm conclusion.
The same series in four and eight slots
A four-slot election-relative grouping was built from 80 annual index returns spanning 1912 through 1992, producing 20 complete cycles. The same annual series was also sorted into eight election-relative year-types instead of four.
A year-type is a calendar slot defined by its place in an election-relative cycle rather than by a calendar year number. Under the eight-slot mapping, 1994 occupied the fourth year-type.
Eight-year election map of average DJIA returns
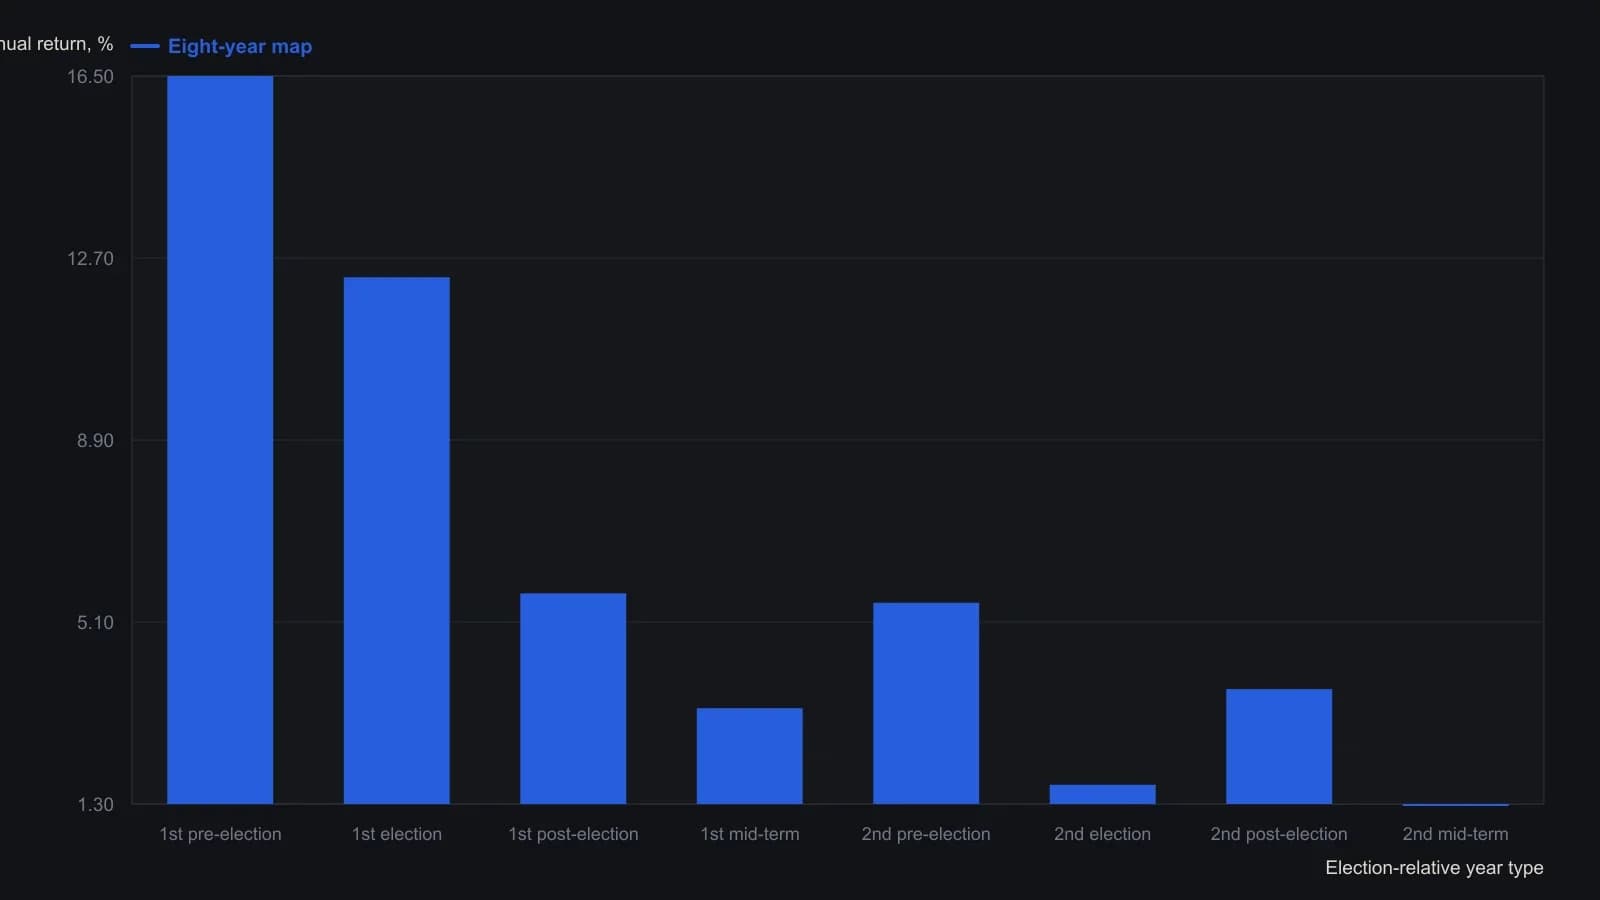
Each bar averages 10 annual observations. White later found this map no more consistent than two random reorderings of the same returns, so the slot means describe the sample rather than a validated edge.
What the two maps suggested
Charting the four-slot sequence twice in succession was presented as a repeating step-down from the pre-election slot through the mid-term slot.
In the eight-slot grouping the first four year-types follow the four-slot sequence while the second four differ, and the second election slot is described as unusually weak. The eight-slot view was described as showing a wider spread of year-type averages than the four-slot view.
Consistency and contrast against chance
Column standard deviation was used as a consistency score and compared with two shuffle-baselines, meaning two random reorderings of the same annual series into the same number of slots. For the four-slot grouping both shuffles were slightly more consistent than the election ordering. The eight-slot shuffle comparison was judged too similar for a firm conclusion, and the actual eight-slot consistency was not lower than the two random samples.
A second dispersion test treated larger contrast across year-type averages as more useful. The four-slot contrast sat well below the random samples while the eight-slot contrast stayed inside chance bounds. Both groupings were framed as needing caution.
All readings on this track · 26 readings
- 1989Known-bias price streams for system evaluation
- 1989Constructing holdout-checked synthetic prices from chaos maps
- 1991Closing the feedback loop in auction market simulations
- 1994Evaluating eight-year election regimes
- 1995Constructing equity versus leverage with resampled trades
- 1995Stock leverage from compounded returns and margin cost
- 1996Constructing and optimizing volatility position-sizing profiles
- 1996Constructing fade rules from an empirical deviation histogram
- 1998Return-path volatility and the recovery burden
- 1999Monte Carlo checks beyond a single historical path
- 2002Monte Carlo equity paths from win rate and profit factor
- 2003Checking a small system edge with Monte Carlo simulation
- 2003Evaluate a mechanical trading system with a stop-loss order and Monte Carlo simulation
- 2005Evaluating momentum rank rotation under portfolio constraints
- 2009Bounded risk and rank rotation in portfolio construction
- 2010A calendar for walk-forward robustness and Monte Carlo evaluation
- 2012Treat the optimize view as an evaluation protocol
- 2013Entry, exit and abstention as one testable procedure
- 2014Evaluating stop and target bounds before fading large moves
- 2014Evaluating system exits when markets get noisier
- 2015Memory-bearing synthetics for dominant-cycle spectra
- 2015Constructing next-session implied-volatility forecasts by reordering closes
- 2016Mechanical systems as a gated factory
- 2017Four-sleeve Monte Carlo annual-loss bounds
- 2018When to retire a mechanical system with Monte Carlo drawdown limits
- 2020Treat mechanical system design as a revalidation lifecycle