1991issue C031-12
Closing the feedback loop in auction market simulations
This case study follows a Monte Carlo simulation in which volume could move price through a specialist, but price did not change volume until a price-responsive trader was added. That single loop change altered fills, inventory, and volatility even when the chart recipe stayed the same.
- A specialist-only random-number auction can let volume move price and still leave volume blind to price until a responsive trader is added.
- The simulated trader used only a day's high, low, and close, then acted at the next opening rather than as an intradayer.
- A moving-average crossover that looked clean under ideal fills produced fewer points once orders could be only partly filled.
- Daily on-balance volume tracked the specialist's inventory: negative readings meant the specialist was long.
Why the first auction stayed incomplete
The earlier random-number market model let volume move price through a simulated specialist, but price did not feed back into volume until a price-responsive trader object was added.
Editorial reading: a Monte Carlo simulation of an auction is incomplete if it can print a new price and nobody is allowed to change size because of that print. The missing object is not a richer chart. It is a participant whose next order depends on the last quote.
How the trader was allowed to act
The simulated trader used only a day's high, low, and close, then acted in time for the next opening rather than as an intraday participant.
If a closing quote signaled a buy while the trader was short, the model first tried to cover the entire position at the next opening and waited for another close before adding a new long.
A specialist-limit market order was always filled, though not always at the current price, while the trader's order stayed within a tick or two of target but could be only partly filled.
A 20-percent band still changed the auction
The first trader sold or shorted when price was more than 20 percent above a base and bought or covered when price was 20 percent below that base.
The trader began able to buy 100 lots, or 10,000 shares, against a 12.50 base priced in eighths, for 125,000 of starting capital. That size was about 60 percent of that simulated stock's normal daily activity and twice the largest random order.
In the 20-percent countertrend run the trader placed nine orders, finished short 17,500 shares at 16.125, and made just under 100 percent on capital. The chart became less volatile, and the specialist's profit rose by almost 30 percent versus the specialist-only run.
A 10-percent band produced more trades and about 20,000 less trader profit. A 12,500-capital trader earned a 238 percent return, and a 250,000-capital trader earned 136 percent, versus 95 percent for the 125,000 account.
The same moving-average crossover under two fill rules
Under assumed ideal fills, 0.80 and 0.20 exponential-average constants produced 12.875 points in 27 reversals. A 500-share trader using those moving-average crossover constants earned only 5.6 points in 23 paired trades.
That small flow still left the specialist about 38.4 percent, or 31,000, richer.
Editorial reading: the chart condition can stay the same while the auction changes the result. Points counted under assumed ideal fills are not the same object as points earned by an order that may be only partly filled.
On-balance volume as a map of inventory
Daily on-balance volume, shares bought minus shares sold, tracked the specialist's inventory. Negative on-balance volume meant the specialist was long, and a late cluster of buy orders let that inventory be reduced.
Editorial reading: once a price-responsive trader is inside the loop, on-balance volume is a way to watch who is left holding the residual, not a separate signal sitting beside the chart.
Countertrend fills against the 20 percent band
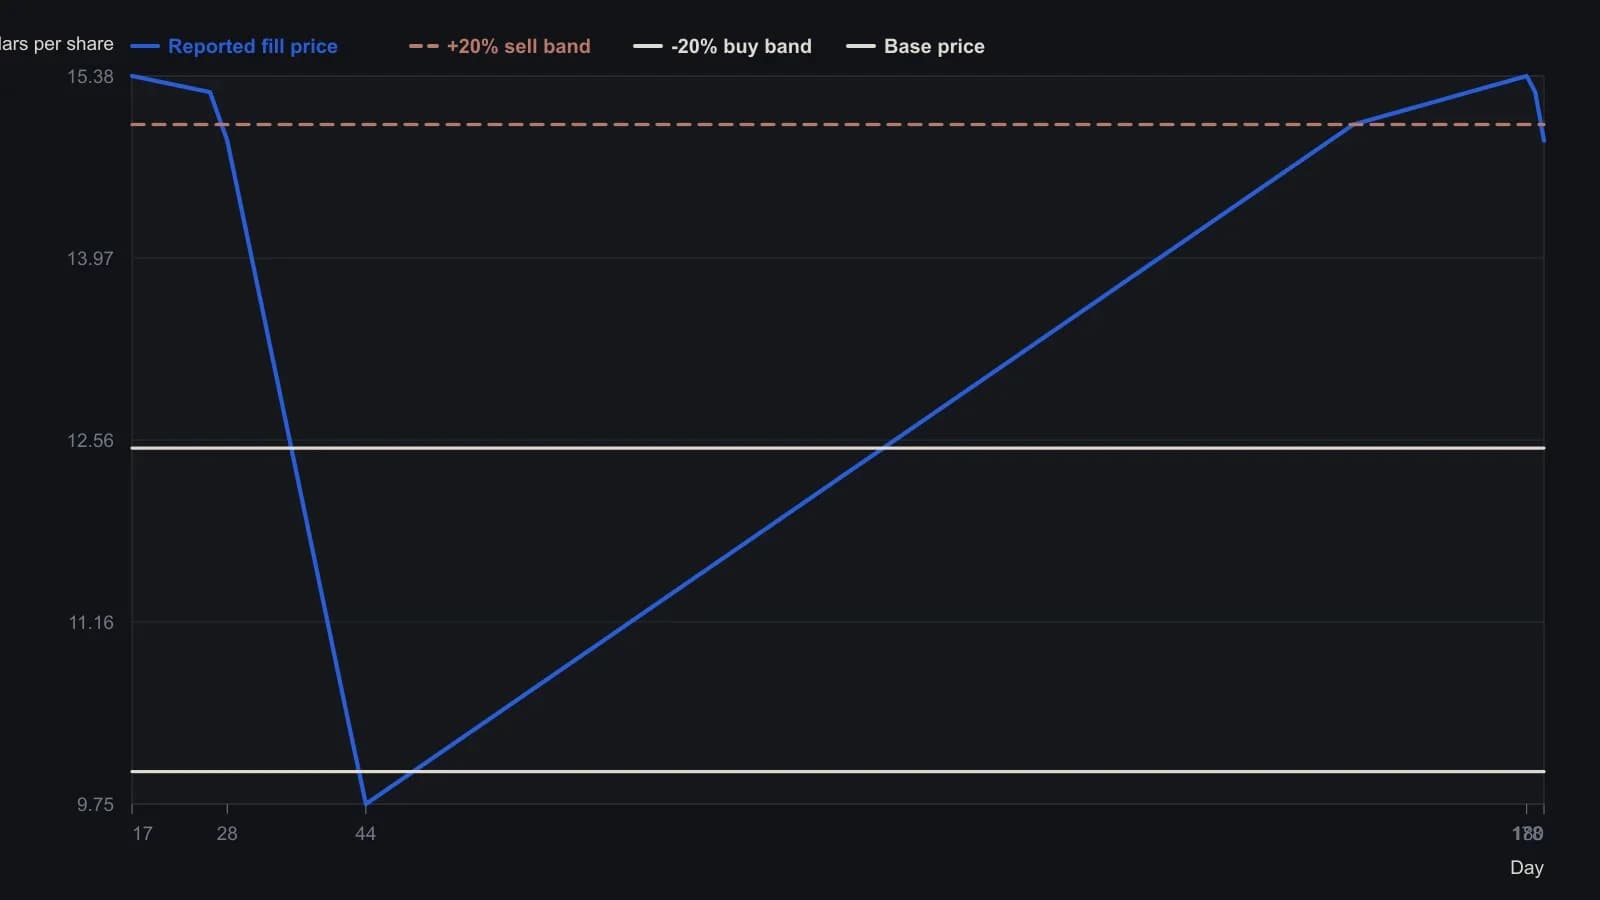
Ticks are 1/8 point. The day-42 cover was filled from the specialist's book at a half-point slip versus the $9.875 target. Daily closes between fills were not printed and are omitted.
All readings on this track · 26 readings
- 1989Known-bias price streams for system evaluation
- 1989Constructing holdout-checked synthetic prices from chaos maps
- 1991Closing the feedback loop in auction market simulations
- 1994Evaluating eight-year election regimes
- 1995Constructing equity versus leverage with resampled trades
- 1995Stock leverage from compounded returns and margin cost
- 1996Constructing and optimizing volatility position-sizing profiles
- 1996Constructing fade rules from an empirical deviation histogram
- 1998Return-path volatility and the recovery burden
- 1999Monte Carlo checks beyond a single historical path
- 2002Monte Carlo equity paths from win rate and profit factor
- 2003Checking a small system edge with Monte Carlo simulation
- 2003Evaluate a mechanical trading system with a stop-loss order and Monte Carlo simulation
- 2005Evaluating momentum rank rotation under portfolio constraints
- 2009Bounded risk and rank rotation in portfolio construction
- 2010A calendar for walk-forward robustness and Monte Carlo evaluation
- 2012Treat the optimize view as an evaluation protocol
- 2013Entry, exit and abstention as one testable procedure
- 2014Evaluating stop and target bounds before fading large moves
- 2014Evaluating system exits when markets get noisier
- 2015Memory-bearing synthetics for dominant-cycle spectra
- 2015Constructing next-session implied-volatility forecasts by reordering closes
- 2016Mechanical systems as a gated factory
- 2017Four-sleeve Monte Carlo annual-loss bounds
- 2018When to retire a mechanical system with Monte Carlo drawdown limits
- 2020Treat mechanical system design as a revalidation lifecycle