2003issue C111-11
Evaluate a mechanical trading system with a stop-loss order and Monte Carlo simulation
A mechanical trading system is a complete entry-and-exit rule set. A stop-loss order can bound the loss at a fixed point distance from the fill, and Monte Carlo simulation can be applied to the completed performance file to produce a distribution of percentage returns.
- Specify the mechanical trading system as a complete entry-and-exit rule set, such as buying or selling short on the next bar when a zigzag-trend state flips.
- Attach a stop-loss order so a long exit or a short cover occurs at a fixed point distance from the fill, bounding the loss before the position is held.
- Apply Monte Carlo simulation to the completed performance file. Repeated trials of the same rule set are meant to produce different equity paths.
- Summarize the trials as a distribution of percentage returns, including a reported case in which half of trials lost more than 19000.
Treat the system as a complete rule set
A mechanical trading system can be specified as a complete entry-and-exit rule set. One form is to buy or sell short on the next bar when a zigzag-trend state flips.
The same mechanical zigzag-trend procedure can be applied either to price or to a calculated series. Evaluation is of a testable rule set rather than of a single plotted indicator.
Attach a stop-loss order before the position is held
A stop-loss order can be attached to a mechanical trading system so that a long exit or a short cover occurs at a fixed point distance from the fill. The stop-loss order bounds the loss before the position is held.
Apply Monte Carlo simulation to the finished file
A Monte Carlo simulation tool can be applied to a completed mechanical-system performance file rather than requiring the simulation to be programmed inside the original strategy.
Repeated Monte Carlo simulation trials of the same mechanical rule set produce different equity paths, which is the intended purpose of the simulation. Results can be summarized as a distribution of percentage returns, including a reported case in which half of trials lost more than 19000.
Profit distribution of a typical mechanical trading system
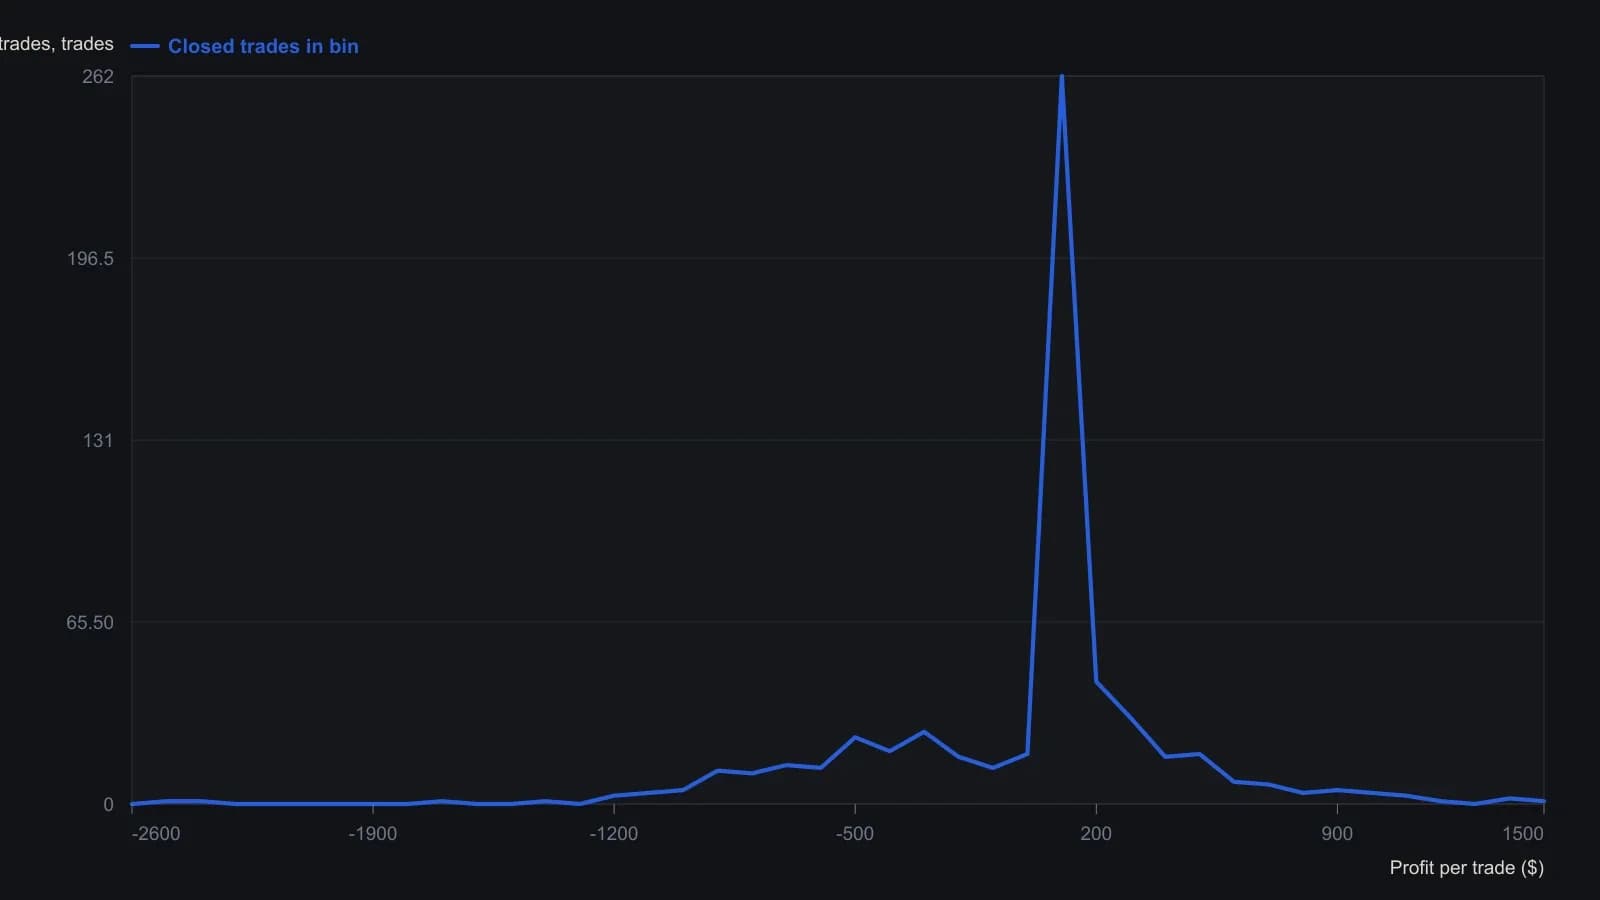
Each column is a $100 profit bin. Counts are the integers printed on the histogram, not interpolated bar heights. The original axis is padded past the last occupied bin, out to about $1,800.
All readings on this track · 26 readings
- 1989Known-bias price streams for system evaluation
- 1989Constructing holdout-checked synthetic prices from chaos maps
- 1991Closing the feedback loop in auction market simulations
- 1994Evaluating eight-year election regimes
- 1995Constructing equity versus leverage with resampled trades
- 1995Stock leverage from compounded returns and margin cost
- 1996Constructing and optimizing volatility position-sizing profiles
- 1996Constructing fade rules from an empirical deviation histogram
- 1998Return-path volatility and the recovery burden
- 1999Monte Carlo checks beyond a single historical path
- 2002Monte Carlo equity paths from win rate and profit factor
- 2003Checking a small system edge with Monte Carlo simulation
- 2003Evaluate a mechanical trading system with a stop-loss order and Monte Carlo simulation
- 2005Evaluating momentum rank rotation under portfolio constraints
- 2009Bounded risk and rank rotation in portfolio construction
- 2010A calendar for walk-forward robustness and Monte Carlo evaluation
- 2012Treat the optimize view as an evaluation protocol
- 2013Entry, exit and abstention as one testable procedure
- 2014Evaluating stop and target bounds before fading large moves
- 2014Evaluating system exits when markets get noisier
- 2015Memory-bearing synthetics for dominant-cycle spectra
- 2015Constructing next-session implied-volatility forecasts by reordering closes
- 2016Mechanical systems as a gated factory
- 2017Four-sleeve Monte Carlo annual-loss bounds
- 2018When to retire a mechanical system with Monte Carlo drawdown limits
- 2020Treat mechanical system design as a revalidation lifecycle