2010issue C0344-49
A calendar for walk-forward robustness and Monte Carlo evaluation
Editorial view: treat system evaluation as a calendar, not a trophy hunt. Freeze a two-year in-sample fit, survive a robustness cull, walk the next six months, then resample that unseen path before the next retest date.
- Choose in-sample and out-of-sample windows first, then search parameters only on the in-sample side.
- Two-year in-sample blocks and the next six months out-of-sample form an 80/20 split that implies reoptimization every six months.
- Robustness testing filters the 676 lookback pairs instead of ranking them by peak net profit, then walk-forward analysis applies each retained pair only to its matching unseen six-month window.
- Monte Carlo simulation resamples the stitched out-of-sample daily returns to sketch the next six-month equity range, then the cycle repeats.
Evaluation as a calendar
Editorial view: system evaluation is a calendar, not a trophy hunt. Freeze a two-year in-sample fit, survive a robustness cull, walk the next six months, then resample that unseen path before the next retest date.
A rules-based evaluation procedure first chooses the in-sample and out-of-sample windows, then searches parameters only on the in-sample side. In-sample is the historical window reserved for parameter search. Out-of-sample is the unseen window reserved for evaluation.
Windows come before the search
The window design uses two-year in-sample blocks and the next six months as out-of-sample, an 80/20 split that implies reoptimization every six months.
After an in-sample choice, the procedure builds a walk-forward equity path on unseen data, then uses Monte Carlo simulation to resample that path, sketch the next six-month equity range, and repeat the cycle six months later.
The rule is reduced before the sweep
A prior three-argument regression rule was reduced to two lookbacks after the slope term showed the weakest contribution. The long-horizon filter and dynamic sizing were removed before retesting.
Two integer rule inputs are swept from 5 through 30, producing 676 combinations that are filtered rather than ranked by peak net profit.
Robustness testing filters combinations
Robustness testing requires beating a period hurdle, then keeps only win-rate and win/loss ratios between the 20th and 80th percentiles. That step removes about 90 percent of combinations before a profit-factor cap. Profit factor is gross profit divided by gross loss.
A 1,000-run Monte Carlo simulation of 126 independent trades approximates profit factor from win rate and average win/loss so combinations implied above 2 can be dropped.
Remaining pairs are judged by whether they sit on a high, locally flat net-profit surface in two-parameter space instead of on an isolated peak.
Walk-forward analysis stitches the unseen path
Each retained pair is applied only to its matching unseen six-month window, and those daily equity changes are stitched into one out-of-sample path.
Monte Carlo simulation sketches the next range
Forward paths resample those out-of-sample daily returns with replacement over 126 sessions, 1,000 times, under an independence assumption later flagged for an autocorrelation check.
Editorial view: the resampled range is a sketch of the next six months on that unseen path, not a prize for the peak in-sample pair. The next retest date is part of the same calendar.
Six-month Monte Carlo ending equity
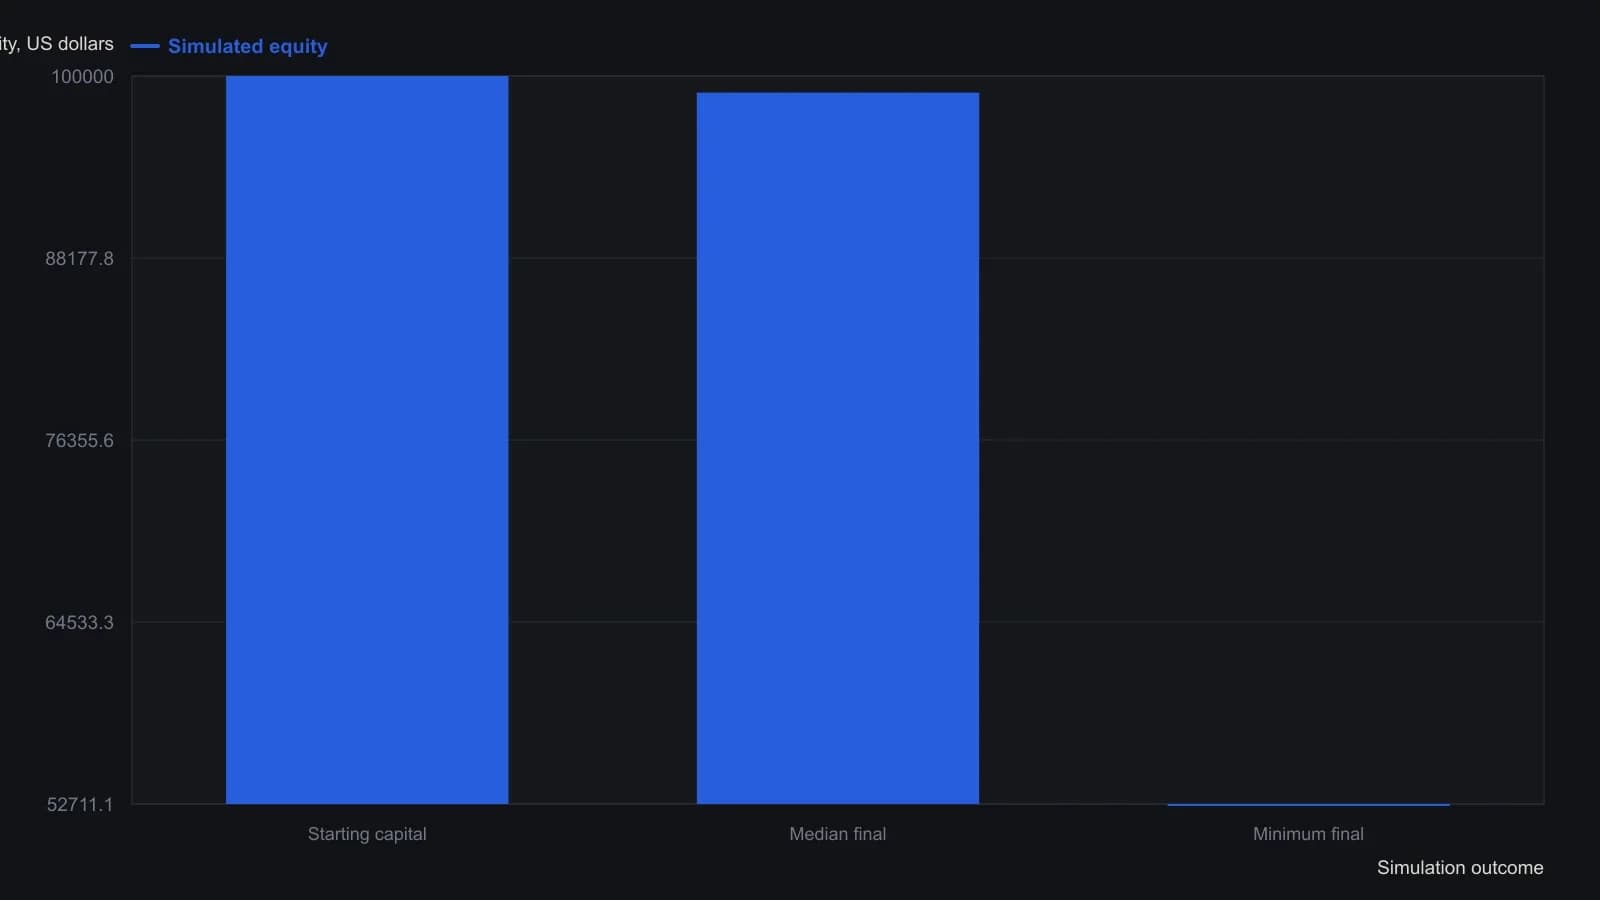
Each resample is 126 trading days, drawn with replacement from the stitched out-of-sample daily returns on SPY. The source also listed a maximum final equity in the mid-$160,000s, but the extracted digits are damaged, so that outcome is omitted rather than repaired.
All readings on this track · 26 readings
- 1989Known-bias price streams for system evaluation
- 1989Constructing holdout-checked synthetic prices from chaos maps
- 1991Closing the feedback loop in auction market simulations
- 1994Evaluating eight-year election regimes
- 1995Constructing equity versus leverage with resampled trades
- 1995Stock leverage from compounded returns and margin cost
- 1996Constructing and optimizing volatility position-sizing profiles
- 1996Constructing fade rules from an empirical deviation histogram
- 1998Return-path volatility and the recovery burden
- 1999Monte Carlo checks beyond a single historical path
- 2002Monte Carlo equity paths from win rate and profit factor
- 2003Checking a small system edge with Monte Carlo simulation
- 2003Evaluate a mechanical trading system with a stop-loss order and Monte Carlo simulation
- 2005Evaluating momentum rank rotation under portfolio constraints
- 2009Bounded risk and rank rotation in portfolio construction
- 2010A calendar for walk-forward robustness and Monte Carlo evaluation
- 2012Treat the optimize view as an evaluation protocol
- 2013Entry, exit and abstention as one testable procedure
- 2014Evaluating stop and target bounds before fading large moves
- 2014Evaluating system exits when markets get noisier
- 2015Memory-bearing synthetics for dominant-cycle spectra
- 2015Constructing next-session implied-volatility forecasts by reordering closes
- 2016Mechanical systems as a gated factory
- 2017Four-sleeve Monte Carlo annual-loss bounds
- 2018When to retire a mechanical system with Monte Carlo drawdown limits
- 2020Treat mechanical system design as a revalidation lifecycle