2002issue C031-4
Monte Carlo equity paths from win rate and profit factor
Two published summaries, the share of winning trades and the ratio of gross wins to gross losses, can be redrawn as many randomized equity-growth paths. Each trade is classified against the win rate, booked as a profit-factor payout or a unit loss, and summed so the same rule set can be inspected as a family of paths.
- A systematic procedure can be evaluated from the share of trades that win and the ratio of gross wins to gross losses.
- Each trade is classified by a uniform random draw on the unit interval and booked as a profit-factor payout or as negative one, so the running sum is an equity-growth path.
- Recalculating those draws from the same two statistics produces a different path, which lets the same rule set be inspected as a family of paths.
- A win rate above one half is not required when winning outcomes are larger than losing outcomes.
Two summary statistics
A systematic procedure can be evaluated from two summary statistics: the share of trades that win and the ratio of gross wins to gross losses. Those two figures are percent profitable and profit factor.
Maximum drawdown, required margin, average result after transaction costs, and runs of consecutive losing trades are listed as additional risk statistics separate from those two summaries. A win rate above one half is not required when winning outcomes are larger than losing outcomes.
Classifying and booking each trade
Profit factor is the ratio of gross winnings to gross losses and is applied as the payout on a trade classified as a win. Each trade is classified by drawing a uniform random number on the unit interval and treating the trade as a win only when that draw falls below the stated win-rate fraction. Percent profitable is that share of trades treated as winners.
A win is booked as the profit-factor payout and a loss is booked as negative one. Expected value is the signed outcome assigned to that classified trade, used to keep each draw's implied gain or loss bounded before the path is summed. The running sum of those signed outcomes is the equity-growth path, plotted so path shape and drawdowns can be compared across reruns.
Several paths from the same statistics
Recalculating the random draws from the same two statistics produces a different equity path, so several paths can be inspected for the same rule set. Robustness testing repeats the same entry, exit, and abstention accounting under new random draws so the procedure itself, not a single backtest order, is what is being evaluated.
Worked illustrations use a 45 percent win rate with a 1.5 profit factor, a 50 percent win rate with a 2.0 profit factor, and a 42 percent win rate with a 1.5 profit factor.
Randomized equity path at 45% wins and 1.5 profit factor
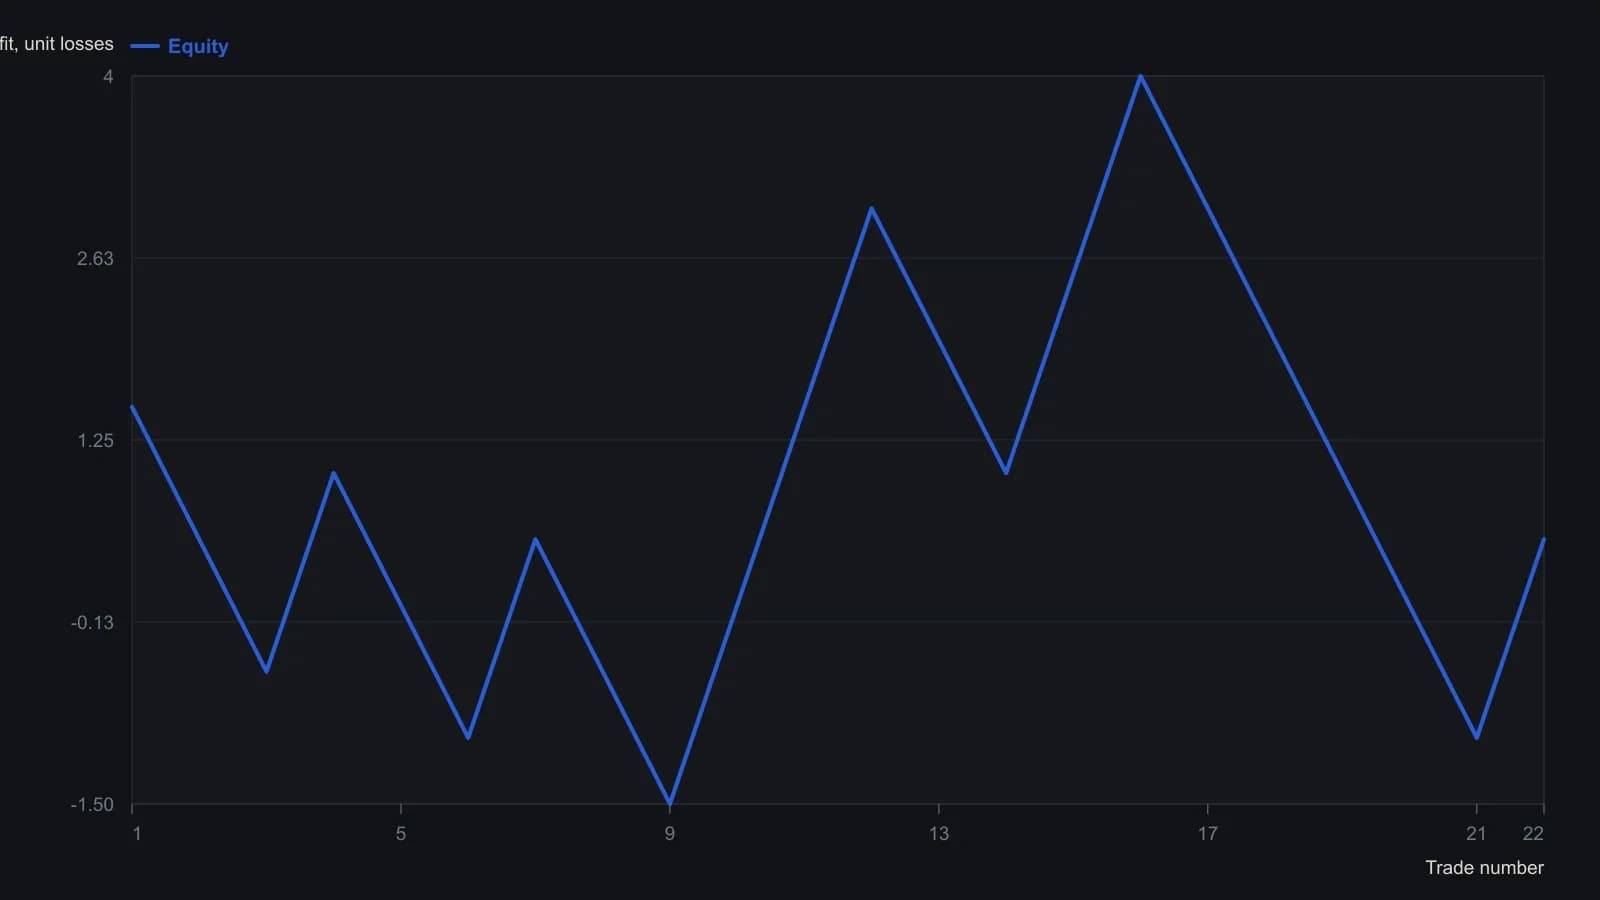
The published Excel plot runs through trade 500. Only spreadsheet rows 3–24 are visible, so this series is the exact readable prefix, not the full randomized path.
An alternative shuffle of realized trades
Monte Carlo simulation is the resampling procedure that randomizes either each trade's win-or-loss label or the order of realized trades so a system is judged from a family of equity paths instead of one historical sequence. An alternative Monte Carlo step shuffles the order of realized trades instead of keeping backtest sequence, then reads expected drawdown from the spread of the resulting distribution around its mean.
Maximum drawdown is the largest peak-to-trough decline on an equity path, treated as a capital-planning statistic alongside required margin.
All readings on this track · 26 readings
- 1989Known-bias price streams for system evaluation
- 1989Constructing holdout-checked synthetic prices from chaos maps
- 1991Closing the feedback loop in auction market simulations
- 1994Evaluating eight-year election regimes
- 1995Constructing equity versus leverage with resampled trades
- 1995Stock leverage from compounded returns and margin cost
- 1996Constructing and optimizing volatility position-sizing profiles
- 1996Constructing fade rules from an empirical deviation histogram
- 1998Return-path volatility and the recovery burden
- 1999Monte Carlo checks beyond a single historical path
- 2002Monte Carlo equity paths from win rate and profit factor
- 2003Checking a small system edge with Monte Carlo simulation
- 2003Evaluate a mechanical trading system with a stop-loss order and Monte Carlo simulation
- 2005Evaluating momentum rank rotation under portfolio constraints
- 2009Bounded risk and rank rotation in portfolio construction
- 2010A calendar for walk-forward robustness and Monte Carlo evaluation
- 2012Treat the optimize view as an evaluation protocol
- 2013Entry, exit and abstention as one testable procedure
- 2014Evaluating stop and target bounds before fading large moves
- 2014Evaluating system exits when markets get noisier
- 2015Memory-bearing synthetics for dominant-cycle spectra
- 2015Constructing next-session implied-volatility forecasts by reordering closes
- 2016Mechanical systems as a gated factory
- 2017Four-sleeve Monte Carlo annual-loss bounds
- 2018When to retire a mechanical system with Monte Carlo drawdown limits
- 2020Treat mechanical system design as a revalidation lifecycle