2020issue C0118-21
Evaluating a two-window seasonal equity-bond switch
The archive treats a calendar split as one seasonal rotation: a mid-cap sleeve in the November-May window, an intermediate Treasury sleeve in the June-October window, and a score built from seasonal windows plus complete bull and bear cycles.
- The tested seasonal rotation holds a mid-cap sleeve from November 1 through May 31 and an intermediate Treasury sleeve from June 1 through October 31.
- A long-run US equity price series treated the June-October window as weak on a multi-decade cumulative basis, while year-to-year results in that window were irregular and included multi-year gain stretches in every decade of the sample.
- Reported outcomes were a hypothetical month-end test of index total returns with no fees deducted, and the mid-cap sleeve was used as a growth-oriented holding between smaller and larger companies.
- Complete bull-to-bull and bear-to-bear cycles were presented as the preferred way to score this mechanical long-horizon rule against a buy-and-hold large-capitalization equity benchmark.
The seasonal split
A long-run US equity price series was split into a November-May window and a June-October window to compare seasonal market behavior.
The June-October window was described as weak on a multi-decade cumulative basis. Year-to-year results in that window were treated as irregular, including multi-year gain stretches inside every decade of the sample.
A locked two-sleeve rotation
The tested procedure is one seasonal rotation. It holds a mid-cap sleeve, a mid-capitalization equity index, from November 1 through May 31, and an intermediate Treasury sleeve, a three- to seven-year Treasury total-return series, from June 1 through October 31.
The mid-cap sleeve was justified as a growth-oriented holding sitting between smaller and larger companies for the November-May window. The mid-capitalization series used in the combined-window test begins later than the long-run seasonal split.
Reported outcomes were a hypothetical month-end test. They used month-end index total returns with no fees deducted and no live execution.
Scoring the rule
The combined-window test compared the seasonal equity-bond rotation with a buy-and-hold large-capitalization equity index. The evaluation table compared average results in each seasonal window, twelve-month and five-year lookbacks, and the frequency of positive multi-year periods.
Complete bull-to-bull and bear-to-bear cycles were presented as the preferred way to score a mechanical long-horizon rule set against a benchmark. Cycle-window evaluation split results from successive bull-market highs and from successive bear-market lows.
The tables noted that the latest bear-to-bear window still lacked a terminal low.
Two-window switch versus S&P 500 across complete bull and bear cycles
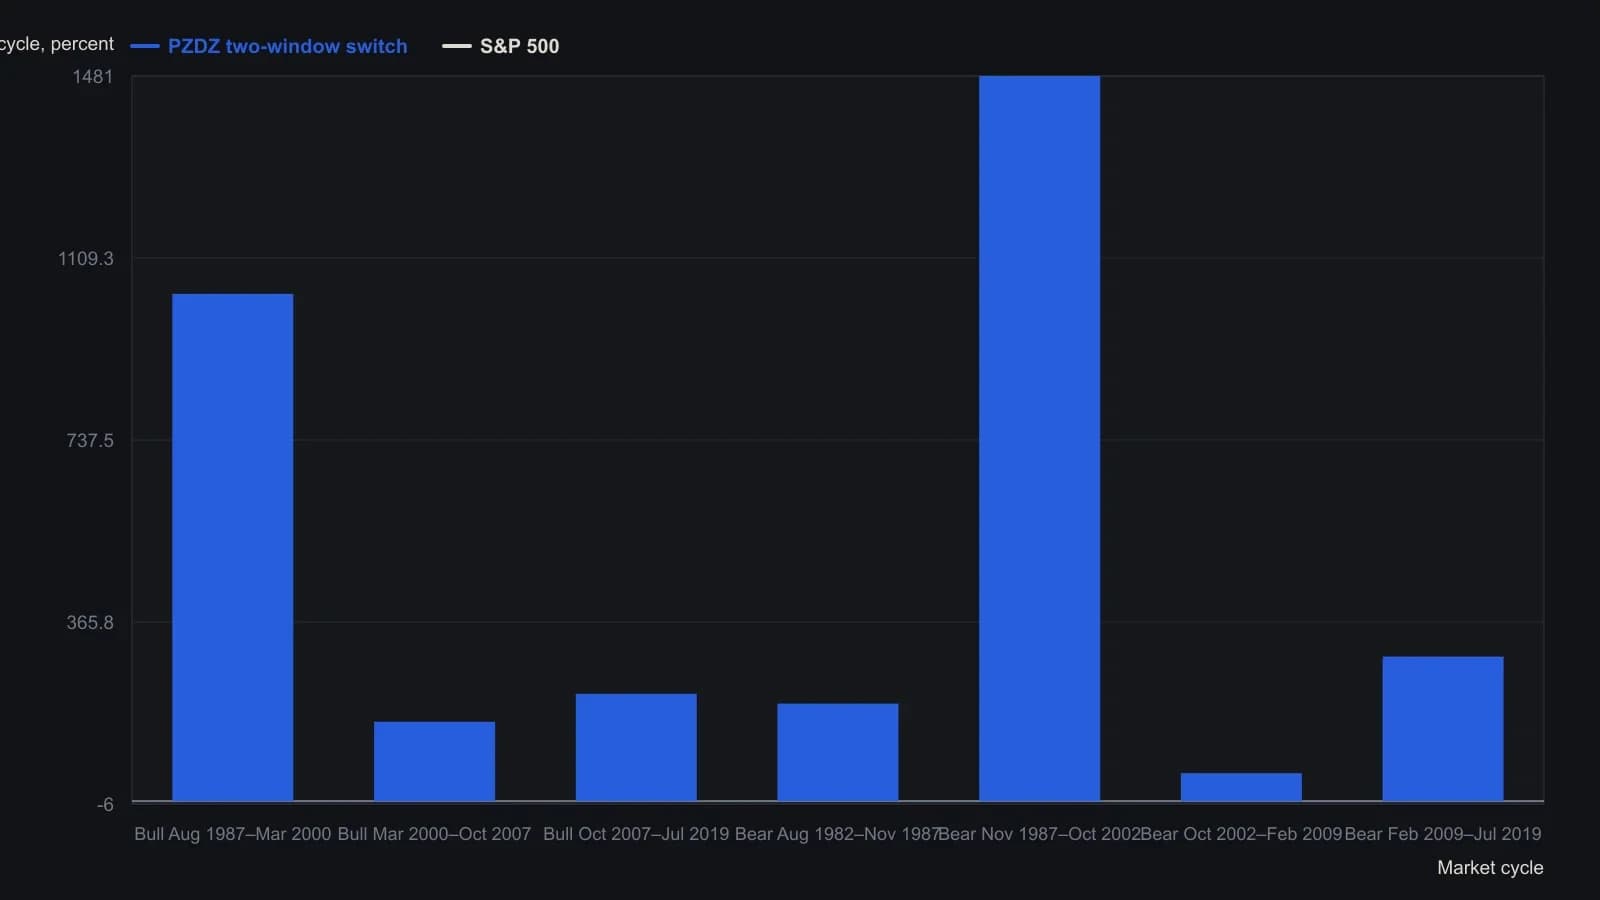
Hypothetical month-end index total returns with no fees. The February 2009–July 2019 bear-to-bear window is incomplete until the next bear-market low.
All readings on this track · 21 readings
- 1991A commodity-bond regime check before an equity relative strength index
- 1993A case study in refusing an isolated entry
- 1994The late-bull intermarket clock and regression-channel gates
- 1995Seasonal and political cycle maps as tested abstention regimes
- 2001Year-end high and low as a four-state regime filter
- 2002A six-market moving-average regime map from 2002
- 2003Gold as a regime marker after equity leadership fades
- 2003A four-season regime map before the shorter chart
- 2003From downtrend to trading range: implied volatility and volume after a shock fades
- 2006Exit discipline after regime shocks
- 2006Liquidity, growth, and midcycle market regimes
- 2006Yield-curve spread as an equity regime filter
- 2008Commodity, credit and bond alignment is not a forecast
- 2013Two lookback windows locate the cycle across bonds, stocks, and commodities
- 2014When ranging ends, replace the relative strength index, not its lookback
- 2016A Treasury-high-yield ratio as an equity regime filter
- 2016One-off shocks versus seasonal and secular regimes
- 2018Yield-curve flattening as missing market-regime context
- 2019Classifying six market phases around a single trade
- 2020Evaluating a two-window seasonal equity-bond switch
- 2020Dating energy regime breaks before the trade