2020issue C0236-39
Dating energy regime breaks before the trade
A three-step classroom procedure that first labels whether an incumbent-versus-challenger energy split is still a live weeks-to-months regime, then places one name inside that cross-market context, then allows entry, exit or abstention only while the label holds.
- Market-regime-classification asks whether the tape still matches an incumbent commodity-energy complex versus a falling-cost challenger complex on a weeks-to-months horizon.
- Seasonal-analysis reads cross-market prices, volatility, carry and portfolio weights so a single energy holding sits inside that regime instead of standing alone.
- Seasonal-trading turns rule inputs, market state and execution constraints into entry, exit or abstention only while the classified regime remains intact.
- The abstention-rule stands aside when the two complexes reconverge or when cost, liability and capital-flow evidence no longer support the label.
Classify the split before the name
The archive narrative framed successive industrial eras as replacements of older energy technologies by newer, more efficient ones, with later demand shifting from resource extraction toward technology-based generation. Three of the largest oil-and-gas firms were listed as the incumbent complex used for later comparison.
Editorial reading: an energy idea is not ready for a trade rule until market-regime-classification has labelled whether an incumbent-versus-challenger split is still a live weeks-to-months regime.
Find the regime-break-date
A weekly comparison showed one large integrated oil equity tracking a broad equity benchmark, then diverging from that relationship for a stretch that lasted months. The regime-break-date is the first week-scale window when that prior relationship stops and the split persists.
One major oil firm was described as seeing revenues fall, with a later write-off of global holdings after other majors had already written off uneconomic reserves. A fossil-divestment analysis attributed a sudden sector downturn mainly to a price drop after hydraulic fracturing.
Solar and wind output were reported higher in a later window, and renewable generation costs were described as moving below coal and gas even after cheaper gas from fracturing. A later energy review still put non-hydro renewables at a small share of global oil-demand equivalent, and vehicle figures still put electric vehicles at a small share of new vehicles sold, with a wide later range for the fleet.
Editorial reading: market-regime-classification is a label for whether the tape still matches an incumbent commodity-energy complex versus a falling-cost challenger complex. A live regime is a persistent split, not a finished replacement.
Exxon broke from the S&P 500 after 2014
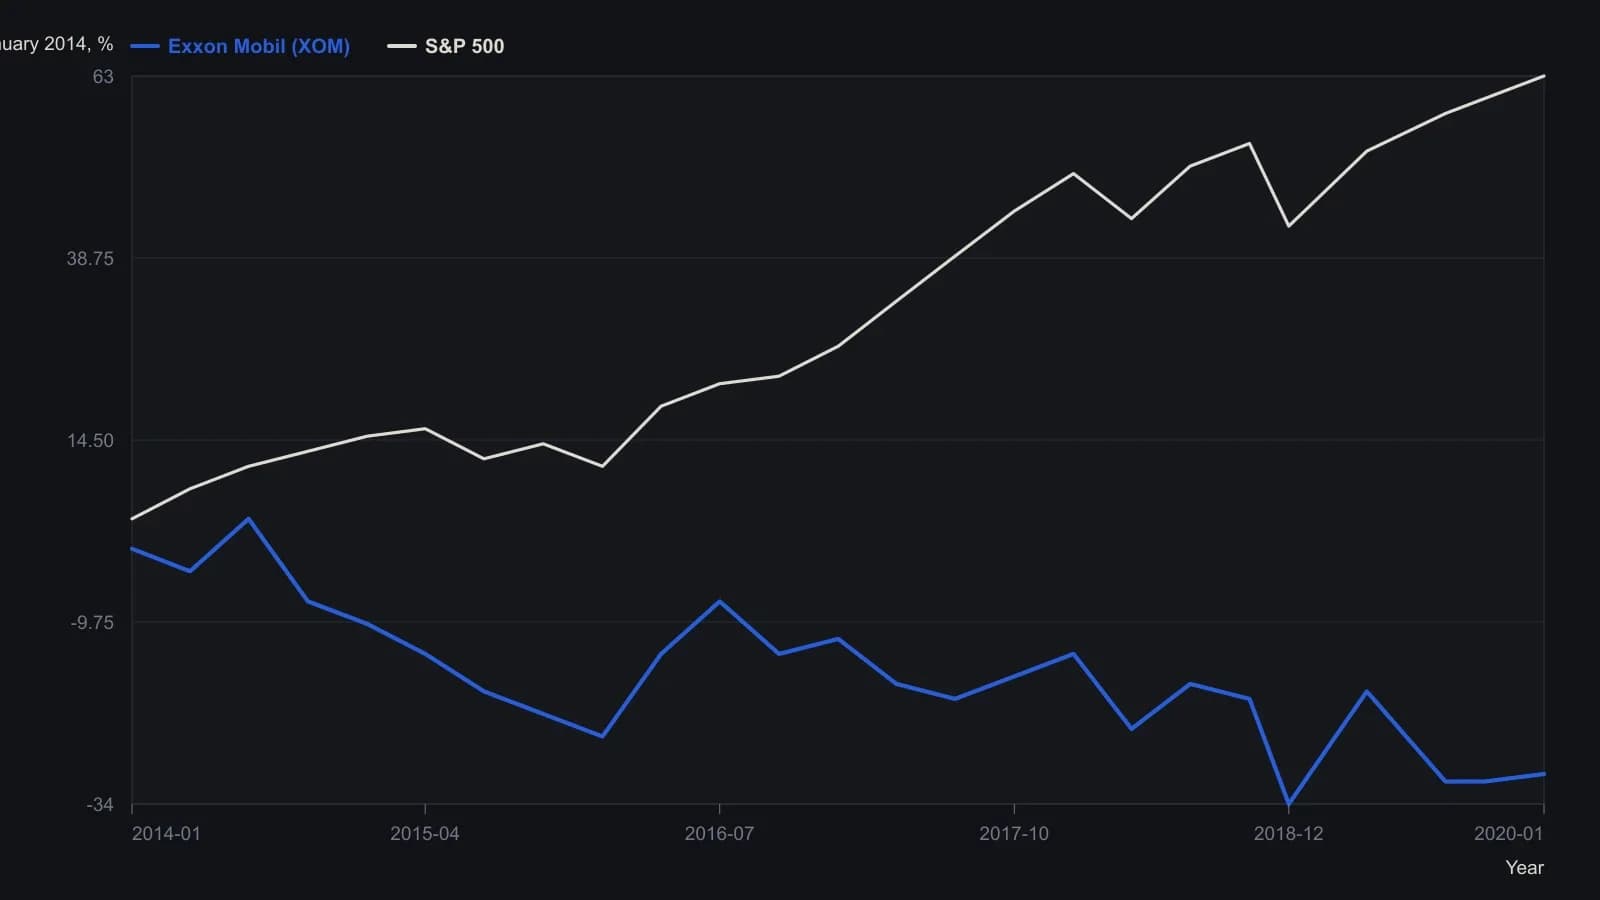
Weekly magazine raster, so turning points are rounded to the nearest percent. The printed right-hand scale is the S&P 500 comparison; XOM was rescaled from the left-hand dollar axis.
Place one name in the cross-market context
Seasonal-analysis is a weeks-to-months read of cross-market prices, volatility, carry and portfolio weights that turns a single energy holding into a regime-aware context instead of a standalone story.
Side-by-side sample-return tables were used to contrast a fossil-fuel cohort with a green-energy and technology cohort after the tracking break. Editorial reading: those tables belong to the context step, not to a standalone call on one name.
Check capital-flow-confirmation
Capital-flow-confirmation is the set of fund-vehicle swaps, heavy-asset sales and underwriting exits that either agree with or contradict the price-based regime label.
Later examples included an oil-focused fund vehicle slated for replacement by a renewables vehicle and large producers selling heavy-oil and oil-sands assets. Climate-related damages were estimated at two stated warming thresholds, with some warming already recorded and a regional cleanup estimate noted, while large insurers limited or exited coal and tar-sands underwriting.
Editorial reading: capital-flow-confirmation can support the classified regime or argue against it. It does not replace the price-based label.
Trade only while the regime holds
Seasonal-trading is one testable procedure that converts rule inputs, market state and execution constraints into entry, exit or abstention over the system holding period.
The abstention-rule is the instruction to stand aside when fossil and clean-energy complexes reconverge or when cost, liability and capital-flow evidence no longer support the classified regime.
Editorial reading: the signal is allowed only while market-regime-classification still says the incumbent-versus-challenger split is intact. When the label fails, the procedure stands aside rather than forcing a standalone story onto a name that has lost its context.
All readings on this track · 21 readings
- 1991A commodity-bond regime check before an equity relative strength index
- 1993A case study in refusing an isolated entry
- 1994The late-bull intermarket clock and regression-channel gates
- 1995Seasonal and political cycle maps as tested abstention regimes
- 2001Year-end high and low as a four-state regime filter
- 2002A six-market moving-average regime map from 2002
- 2003Gold as a regime marker after equity leadership fades
- 2003A four-season regime map before the shorter chart
- 2003From downtrend to trading range: implied volatility and volume after a shock fades
- 2006Exit discipline after regime shocks
- 2006Liquidity, growth, and midcycle market regimes
- 2006Yield-curve spread as an equity regime filter
- 2008Commodity, credit and bond alignment is not a forecast
- 2013Two lookback windows locate the cycle across bonds, stocks, and commodities
- 2014When ranging ends, replace the relative strength index, not its lookback
- 2016A Treasury-high-yield ratio as an equity regime filter
- 2016One-off shocks versus seasonal and secular regimes
- 2018Yield-curve flattening as missing market-regime context
- 2019Classifying six market phases around a single trade
- 2020Evaluating a two-window seasonal equity-bond switch
- 2020Dating energy regime breaks before the trade