1991issue C061-14
A commodity-bond regime check before an equity relative strength index
The archive treated an equity-only oscillator as incomplete until commodities and bonds had classified the backdrop. A relative strength index reading stayed a local timing vote and was accepted or discarded after that regime check.
- Single-market technical indicators applied only to equities were described as incomplete because the forces that move stocks often originate outside that market, especially in bonds.
- Market-regime classification of the commodity, bond, and equity alignment came first. The relative strength index was then accepted or discarded as a local timing vote.
- Bonds and stocks were said to travel in the same direction most of the time, with bonds turning first, so a stock advance unconfirmed by bonds was read as a cross-market divergence rather than a finished signal.
- A commodity-basket proxy, gold leadership, bond-equivalent utilities, foreign-market confirmation, and a lagged-dollar channel supplied the outside context for that check.
Why an equity-only reading was incomplete
Single-market technical indicators applied only to equities were described as incomplete because the forces that move stocks often originate outside that market, especially in bonds.
Intermarket analysis compared stocks, bonds, commodities, currencies, and related equity groups so that outside markets could supply the missing context for a single-market chart.
Market-regime classification labelled the backdrop by whether commodities, bonds, and stocks sat in the expected inflation or disinflation alignment, including when that alignment broke.
How bonds, commodities, and stocks were aligned
Comparison charts were said to show bonds and stocks usually traveling in the same direction, with bonds turning first. The spring 1987 bond decline was cited as the clearest lead.
A 21-commodity basket was used as the commodity-basket proxy and as the first-stop inflation and commodity-regime gauge. Oil, gold, and grains were tracked as additional sector clues.
A 1989 warning from the commodity-basket proxy
In the first half of 1989 a descending triangle in that basket warned of falling commodities and rising bonds. The May commodity breakdown coincided with a bond breakout, and by October commodities were rallying while bonds weakened.
Gold was treated as a historical leader of the commodity basket. In spring 1989 it led the basket lower and anticipated the May breakdown by two months. A June-through-September gold double bottom hinted at a basket low.
Bond-equivalent utilities as a confirmation check
The Dow utility average was treated as bond-equivalent utilities and was said to track bonds more closely than industrials. It served as a stand-in for bonds when checking whether an industrial advance was confirmed.
The early-1991 industrial advance toward 3000 lacked confirmation from sideways utilities and from bonds. That unconfirmed advance was read as a cross-market divergence, a regime warning that appears when two markets that usually travel together stop doing so.
Foreign confirmation and the lagged-dollar channel
Foreign markets were used as confirmation. In summer 1990 a U.S. industrial high near 3000 coincided with a British triple top and a Nikkei rebound of only about 50 percent after its first-half drop.
Dollar moves were treated as a lagged-dollar channel: currency moves reach bonds and stocks mainly after they have first shifted commodity prices. A weaker dollar was not automatically hostile to bonds and stocks until it lifted commodities, and the later commodity bounce was described as a delayed response to earlier dollar weakness.
Where the relative strength index sat
The relative strength index and related single-market oscillators remained the local timing toolkit. They were checked against other markets so that a stock advance unconfirmed by bonds was read as a regime divergence rather than a finished signal.
When stocks and bonds fell together
When stocks and bonds fell together, commodities were described as the remaining rising sector and as a negatively correlated asset class. Commodity prices were also treated as the earliest inflation gauge, with official producer and consumer indexes lagging. The post-easing 1991 commodity uptick was described as making further policy easing harder.
CRB basket through the 1989 break and 1990 rebound
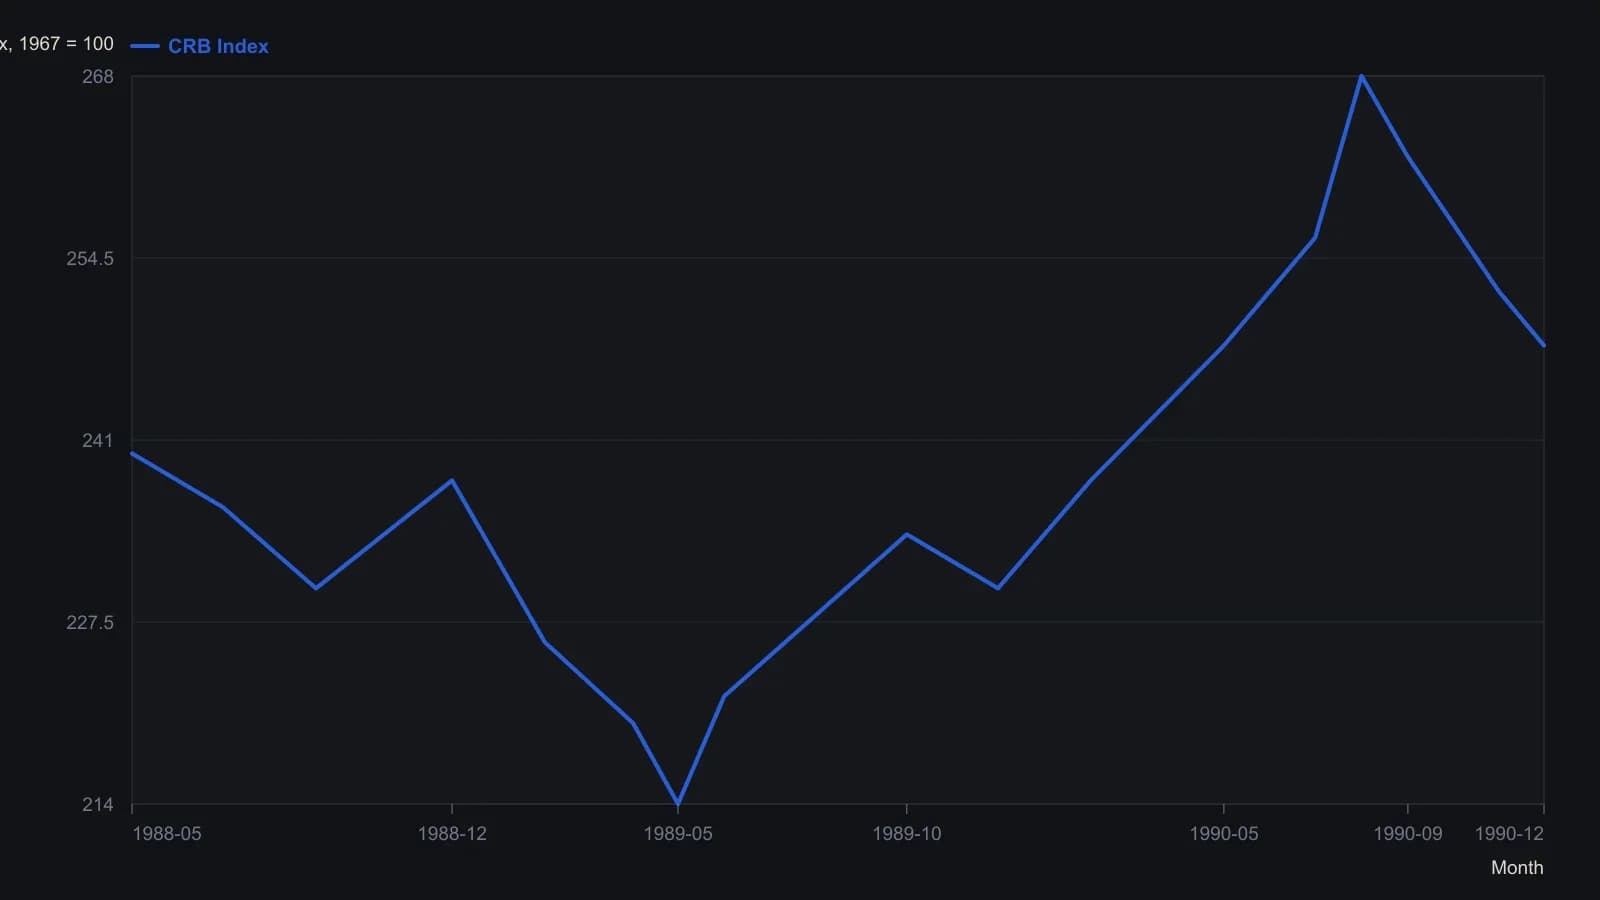
Digitized from the upper pane only. The scan supports whole-index-point precision at best; month labels and the late-chart spike were used as time anchors. The lower pane was left unread because its scale and instrument could not be named with certainty.
All readings on this track · 21 readings
- 1991A commodity-bond regime check before an equity relative strength index
- 1993A case study in refusing an isolated entry
- 1994The late-bull intermarket clock and regression-channel gates
- 1995Seasonal and political cycle maps as tested abstention regimes
- 2001Year-end high and low as a four-state regime filter
- 2002A six-market moving-average regime map from 2002
- 2003Gold as a regime marker after equity leadership fades
- 2003A four-season regime map before the shorter chart
- 2003From downtrend to trading range: implied volatility and volume after a shock fades
- 2006Exit discipline after regime shocks
- 2006Liquidity, growth, and midcycle market regimes
- 2006Yield-curve spread as an equity regime filter
- 2008Commodity, credit and bond alignment is not a forecast
- 2013Two lookback windows locate the cycle across bonds, stocks, and commodities
- 2014When ranging ends, replace the relative strength index, not its lookback
- 2016A Treasury-high-yield ratio as an equity regime filter
- 2016One-off shocks versus seasonal and secular regimes
- 2018Yield-curve flattening as missing market-regime context
- 2019Classifying six market phases around a single trade
- 2020Evaluating a two-window seasonal equity-bond switch
- 2020Dating energy regime breaks before the trade