2003issue C041-5
Gold as a regime marker after equity leadership fades
A late-2002 archive case used gold, gold funds, and hedged versus unhedged gold shares to ask whether leadership had left the dollar and equity cycle that began in 1982. Editorial reading: that tape is a check on whether the portfolio is still priced for the old cycle, not a standalone metal forecast.
- Editorial reading: when leadership leaves financial assets, gold's relative bid is a regime check on whether the portfolio is still priced for the old dollar and equity cycle, not a standalone price forecast.
- The 1970s gold advance was framed as a decline in the dollar's purchasing power, and the 1980s and 1990s rise in the dollar plus the boom in stocks and bonds were presented as the counterpart to gold's long bear market as the antifinancial asset.
- After a 2001 retest near $260 an ounce, gold, gold-oriented funds, and unhedged gold-share indexes advanced together through late 2002, a contrast the source had already treated in 2000 as a possible changing of the guard.
- Intermarket analysis and market regime classification place that single-metal move next to the dollar, equities, bonds, and hedge stance rather than treating it as an isolated call.
A single metal as a regime check
Editorial reading: when leadership leaves financial assets, gold can be read as a regime marker. The relative bid is less a forecast of the next price and more a check on whether the portfolio is still priced for the old dollar and equity cycle.
A 1999 commentary argued that the bull market in US equities and bonds that began in 1982 had ended in 2000 and that leadership would shift to another asset class.
In 2000, selected gold funds declined while the S&P 500 also fell about 10%. The source treated that contrast as a possible changing of the guard from stocks toward gold.
The cycle gold sat against
After convertibility between the dollar and gold ended in 1971, gold rose from a fixed $35 an ounce to more than $850 an ounce at the early-1980 peak. The 1970s gold advance was framed as a decline in the dollar's purchasing power rather than a change in the metal's physical scarcity.
Gold entered a bear market by early 1981, reached about $290 in early 1985, then fell as low as $250 in 1999 and again in 2001 after later failed rallies.
The 1980s and 1990s secular rise in the dollar and the boom in stocks and bonds were presented as the counterpart to gold's long bear market as the antifinancial asset.
What changed after 2000
After a 2001 retest near $260 an ounce, gold rose to $290 by year-end 2001 and above $340 by late 2002. By late 2002, gold-oriented mutual funds were reported as a group to be up about 50% for the year after an average gain of almost 19% in 2001.
Unhedged gold-share indexes outperformed hedged ones after 2000. The $HUI was up 55.8% in 2001 and more than 118% year-to-date by mid-December 2002, versus 4.2% and 44.0% for the $XAU.
In 1999, leading central banks signed an agreement limiting official gold sales and affirming gold as an important reserve asset, with an initial five-year term due to expire in September 2004.
How the methods frame the tape
Intermarket analysis places the metal next to the dollar, equities, bonds, and the hedge stance of gold shares. Market regime classification asks whether those relationships still look like the financial-asset boom or like a shift toward gold as the antifinancial asset.
Editorial note: that classification is a portfolio-context check on a weeks-to-months horizon. It does not turn the 2001 to 2002 advance into a standing forecast.
COMEX gold weekly, 1997–2002
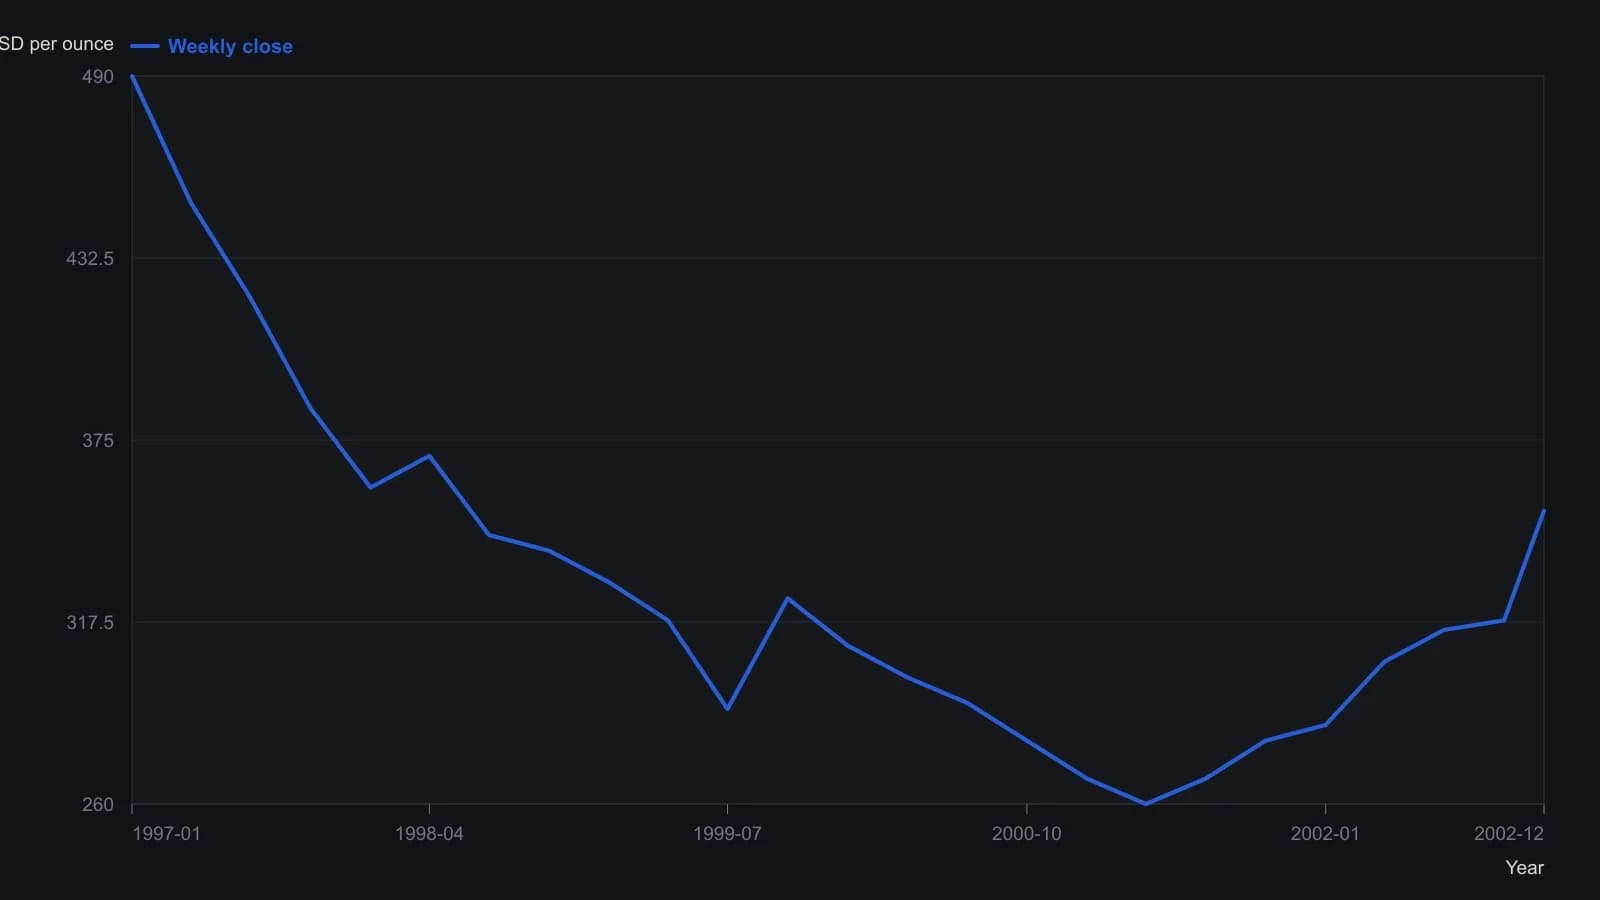
Closes digitized from the weekly bar chart; y-scale is nonlinear so mid-range prices are approximate. Last printed close is 352.60.
All readings on this track · 21 readings
- 1991A commodity-bond regime check before an equity relative strength index
- 1993A case study in refusing an isolated entry
- 1994The late-bull intermarket clock and regression-channel gates
- 1995Seasonal and political cycle maps as tested abstention regimes
- 2001Year-end high and low as a four-state regime filter
- 2002A six-market moving-average regime map from 2002
- 2003Gold as a regime marker after equity leadership fades
- 2003A four-season regime map before the shorter chart
- 2003From downtrend to trading range: implied volatility and volume after a shock fades
- 2006Exit discipline after regime shocks
- 2006Liquidity, growth, and midcycle market regimes
- 2006Yield-curve spread as an equity regime filter
- 2008Commodity, credit and bond alignment is not a forecast
- 2013Two lookback windows locate the cycle across bonds, stocks, and commodities
- 2014When ranging ends, replace the relative strength index, not its lookback
- 2016A Treasury-high-yield ratio as an equity regime filter
- 2016One-off shocks versus seasonal and secular regimes
- 2018Yield-curve flattening as missing market-regime context
- 2019Classifying six market phases around a single trade
- 2020Evaluating a two-window seasonal equity-bond switch
- 2020Dating energy regime breaks before the trade