1993issue C031-9
A case study in refusing an isolated entry
The archive treats equity markets as cycling between high-multiple enthusiasm and near-book-value pessimism. This case study places one name inside that regime first, then requires participation breadth, then runs a written stay, exit, or abstain procedure.
- Classify the market as enthusiasm, pessimism, or in between before a single name is allowed to stand as a thesis.
- Treat market-breadth as a participation test: buying-power versus selling-power should mark accumulation or distribution, not a lone chart.
- Keep screens, a relative-strength-hold, unfunded leadership-theme baskets, and a sit-out overlay inside one checklist-process.
- Use normalized-earnings so a boom or recession year does not flip the valuation-regime call.
An isolated name is not the thesis
The source describes equity markets as cycling between high-multiple enthusiasm and near-book-value pessimism. Those swings are treated as persistent because prices are driven by greed and fear.
In that setting a single long or a single short is incomplete. The name still has to be judged against the cycle, not against its own sheet alone.
Price/earnings multiples are used as sentiment gauges for both single names and the whole market. An extremely compressed multiple is treated as extreme negative sentiment. A much richer multiple is treated as sitting at the high end of historical readings.
Sort the market into a valuation regime
market-regime-classification, as used here, sorts the market into enthusiasm, pessimism, or in-between states with valuation, carry, and portfolio stance so a single trade is judged against the cycle.
A long valuation archive of price/earnings, yields, and book values is used to argue that the market gravitates between overenthusiasm and overpessimism. Across long samples the archive treats a central historical multiple as typical, a much higher multiple as expensive, and a much lower multiple as cheap.
Normalize earnings before the multiple is read
For cyclicals, latest-year earnings are rejected because those names often print their lowest multiple at a price peak. A boom year or a recession year would otherwise warp the regime call.
Earnings are instead turned into normalized-earnings: a multi-year average, or an average of many recent quarters, so one year does not set the multiple. That smoother path is meant to match a typical cycle of a long expansion and a shorter contraction.
Normalized S&P 500 P/E by historical decile, 1926–1992
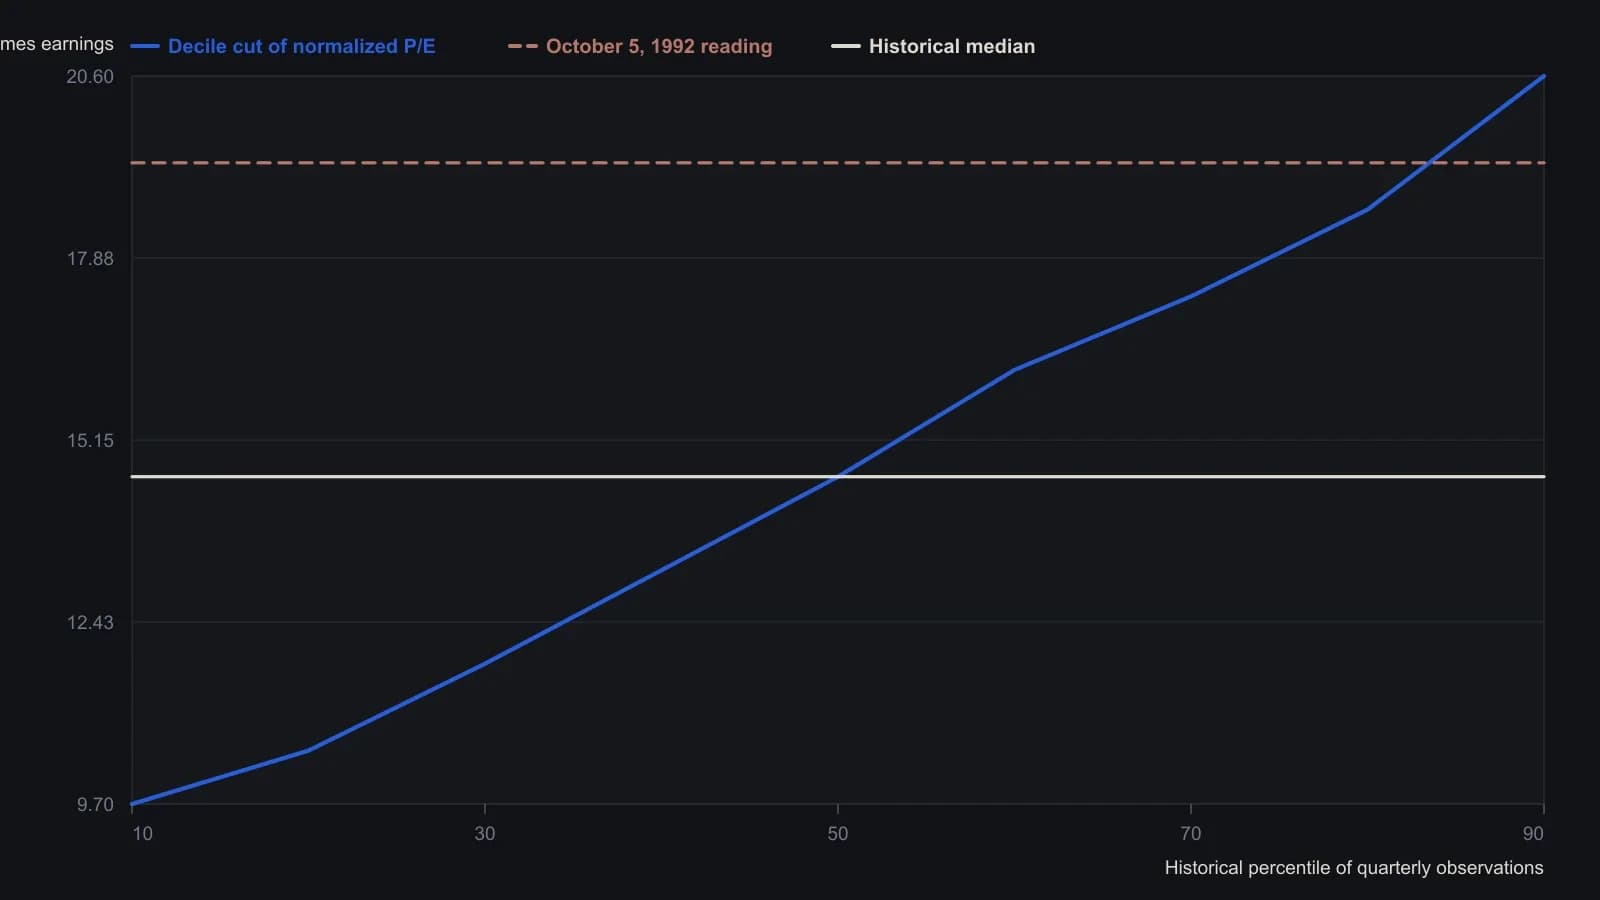
Earnings are averaged over five years (the last 20 quarters) so a single boom or recession year does not warp the multiple. The chart’s October 5, 1992 print is 19.3; the article caption separately cites 19.9 for the 1992 third-quarter average.
Ask how widely prices participate
market-breadth measures how widely prices participate through buying versus selling pressure and related price-volume structure, then treats that participation as a testable signal.
Each week a large battery of diagnostic measures of tops, bottoms, and long-term trends is run. Extra weight is given to a front-weighted momentum curve used to confirm new uptrends after they are already under way.
A buying-power index combines fractional gains of active stocks with the volume of issues that close higher. A selling-power index combines fractional losses with the volume of declining issues. Together they mark major accumulation and distribution. The tape is asked whether the move is widely shared, not whether one name looks ready.
Write stay, exit, and abstain as one procedure
checklist-process is a written pre-trade procedure that combines screens, overlays, and abstention rules so entry, hold, exit, and sitting out are one falsifiable process.
The stock process begins with computer screens of balance-sheet items and price/earnings multiples to isolate unloved names. Momentum or relative strength is then overlaid to refine timing.
A relative-strength-hold keeps a name that continues to outperform even when it looks expensive. When the name is overvalued and relative strength stops making new highs, that is the exit.
Prospective leadership-theme ideas are turned into stock baskets and tracked for years. Capital is withheld unless the market confirms. A developing-Europe theme is described as a share of equity exposure, not as an automatic allocation.
The operating list also includes a flexibility cap on assets and on how many names may be held, an overlay that decides when not to hold fund exposure, and a preference for historically depressed valuation windows.
All readings on this track · 21 readings
- 1991A commodity-bond regime check before an equity relative strength index
- 1993A case study in refusing an isolated entry
- 1994The late-bull intermarket clock and regression-channel gates
- 1995Seasonal and political cycle maps as tested abstention regimes
- 2001Year-end high and low as a four-state regime filter
- 2002A six-market moving-average regime map from 2002
- 2003Gold as a regime marker after equity leadership fades
- 2003A four-season regime map before the shorter chart
- 2003From downtrend to trading range: implied volatility and volume after a shock fades
- 2006Exit discipline after regime shocks
- 2006Liquidity, growth, and midcycle market regimes
- 2006Yield-curve spread as an equity regime filter
- 2008Commodity, credit and bond alignment is not a forecast
- 2013Two lookback windows locate the cycle across bonds, stocks, and commodities
- 2014When ranging ends, replace the relative strength index, not its lookback
- 2016A Treasury-high-yield ratio as an equity regime filter
- 2016One-off shocks versus seasonal and secular regimes
- 2018Yield-curve flattening as missing market-regime context
- 2019Classifying six market phases around a single trade
- 2020Evaluating a two-window seasonal equity-bond switch
- 2020Dating energy regime breaks before the trade