2002issue C111-3
A six-market moving-average regime map from 2002
A 2002 snapshot lined up the US dollar index, three equity benchmarks, the ten-year Treasury note, and the CRB index by where each sat relative to its fifty-day and two-hundred-day moving averages. Editorial reading: the grid is one joint market-regime classification, not six separate next-tick forecasts.
- In the 2002 snapshot, equity indexes in the United States, Japan, and Europe sat in below-average moving-average regimes while the ten-year Treasury note occupied an above-average price regime.
- The US dollar index broke below its fifty-day moving average in April 2002 and its two-hundred-day moving average in June, more than two years after US equities had peaked.
- The CRB index turned up after an early-2002 bottom test while remaining inside the 180 to 220 band that had framed commodity prices since 1971.
- Editorial reading: when several equity benchmarks lose both averages, the dollar loses its long average, and the long Treasury holds above its long average, the lesson is the cross-asset classification rather than six separate next-tick forecasts.
How the six-market grid is read
A moving average is a lookback average of ordered prices used as an explicit baseline for whether a market is holding above or below its recent path. In these charts the fifty-day moving average is the short-horizon, nearer trend baseline, and the two-hundred-day moving average is the longer-horizon, slower trend baseline.
Market-regime classification labels a market or portfolio backdrop from where prices sit relative to those short and long moving averages and how the labels line up across assets. Intermarket analysis reads several asset classes side by side so a single chart is placed in a broader market-regime context.
Equity indexes in a below-average regime
After losing its fifty-day moving average in summer 2000, the capitalization-weighted S&P 500 stayed in a multi-year descent and crossed below its two-hundred-day moving average in summer 2001.
After an early-2000 collapse, the Nikkei 225 spent 2000 and 2001 below both its fifty-day and two-hundred-day moving averages, and those two averages began to level in the first half of 2002.
The FTSE Eurotop 100 fell through its fifty-day moving average in late 2000 and its two-hundred-day moving average in summer 2001, tracking the same sequence of corrections and countertrend rallies as US equities from 2000 onward.
The dollar, the Treasury note, and commodities
In spring 2002 the US dollar index, a trade-weighted geometric average of six currencies, broke below its fifty-day moving average in April and its two-hundred-day moving average in June, more than two years after US equities had peaked. The US dollar index is a trade-weighted geometric average of the euro, yen, pound, Canadian dollar, Swedish krona, and Swiss franc.
The ten-year Treasury note traded above its two-hundred-day moving average from late 2000, briefly lost its fifty-day moving average in autumn 2001, struggled again in early 2002, then reasserted an upward price regime by summer 2002. The ten-year Treasury note is the US government coupon issue treated here as the long-term rate benchmark, with price moving opposite yield.
The CRB index advanced from mid-1999 to late 2000, declined from late 2000 to late 2001, and turned up after an early-2002 bottom test, while remaining inside an 180 to 220 band that had framed commodity prices since 1971. The CRB index is an unweighted geometric mean of seventeen listed futures markets with a 1967 base of 100.
A split across asset classes
In this 2002 snapshot, equity indexes in the United States, Japan, and Europe sat in below-average moving-average regimes while the ten-year Treasury note occupied an above-average price regime, a split between risk assets and the long government benchmark. Editorial reading: that alignment is the joint map, not six isolated path calls.
S&P 500 weekly versus 50- and 200-period moving averages, 1999–2002
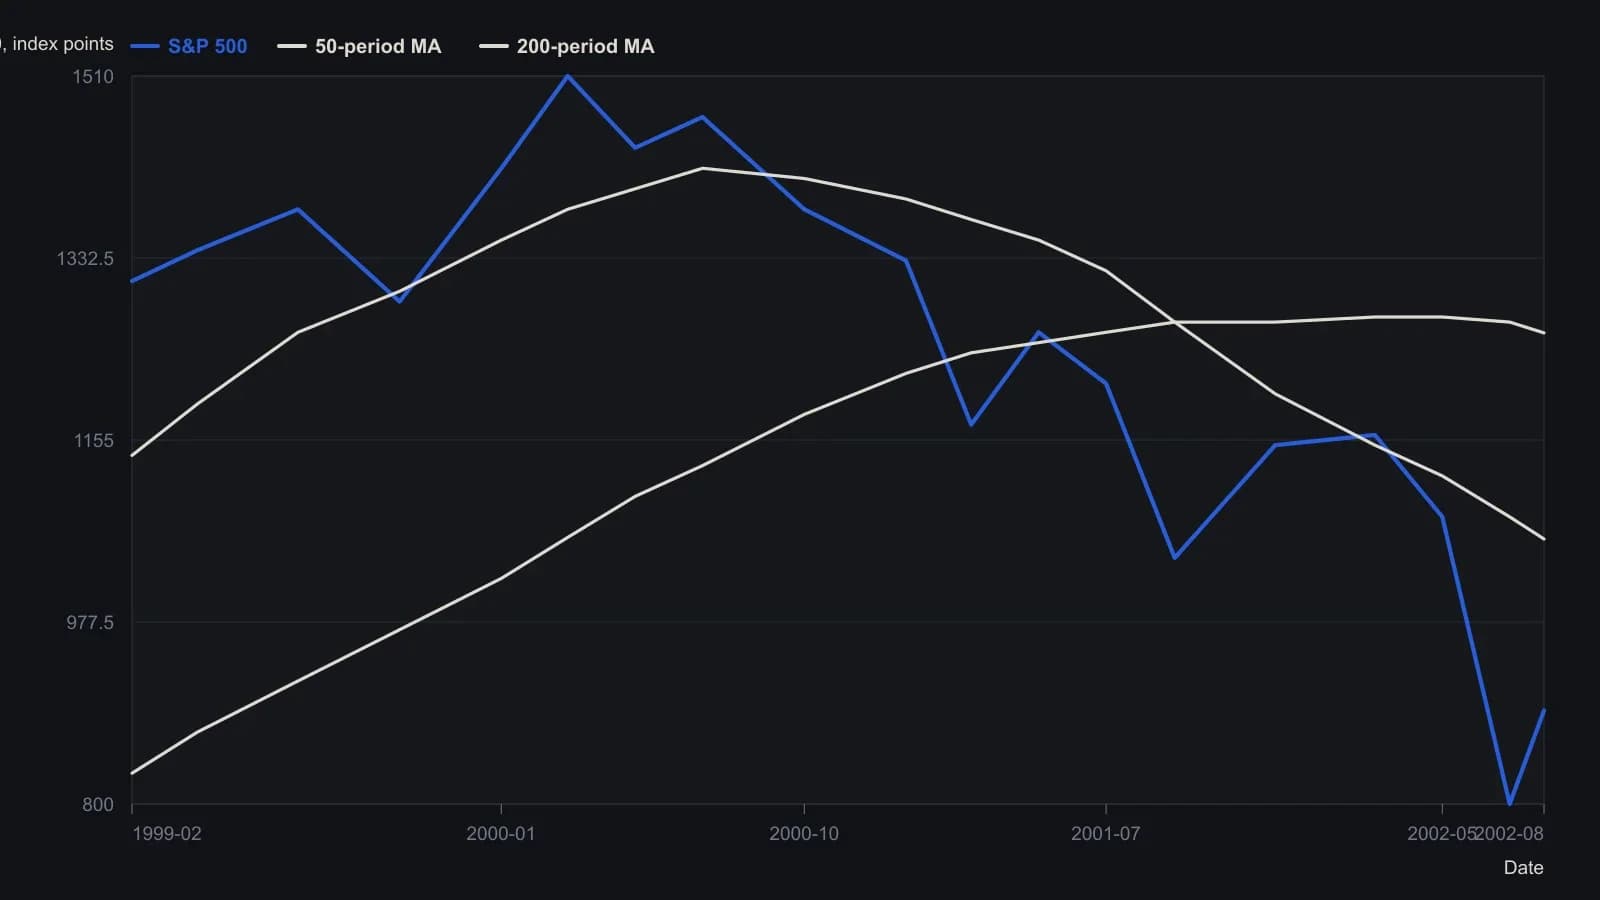
Overlays are the 50-period (faster) and 200-period (slower) moving averages on weekly bars. Intermediate points are digitized from the raster and rounded to the nearest ten index points; only the final labeled prints keep the printed decimals.
All readings on this track · 21 readings
- 1991A commodity-bond regime check before an equity relative strength index
- 1993A case study in refusing an isolated entry
- 1994The late-bull intermarket clock and regression-channel gates
- 1995Seasonal and political cycle maps as tested abstention regimes
- 2001Year-end high and low as a four-state regime filter
- 2002A six-market moving-average regime map from 2002
- 2003Gold as a regime marker after equity leadership fades
- 2003A four-season regime map before the shorter chart
- 2003From downtrend to trading range: implied volatility and volume after a shock fades
- 2006Exit discipline after regime shocks
- 2006Liquidity, growth, and midcycle market regimes
- 2006Yield-curve spread as an equity regime filter
- 2008Commodity, credit and bond alignment is not a forecast
- 2013Two lookback windows locate the cycle across bonds, stocks, and commodities
- 2014When ranging ends, replace the relative strength index, not its lookback
- 2016A Treasury-high-yield ratio as an equity regime filter
- 2016One-off shocks versus seasonal and secular regimes
- 2018Yield-curve flattening as missing market-regime context
- 2019Classifying six market phases around a single trade
- 2020Evaluating a two-window seasonal equity-bond switch
- 2020Dating energy regime breaks before the trade