2013issue C0138-40
Two lookback windows locate the cycle across bonds, stocks, and commodities
In editorial terms, a cycle-stage label is a hypothesis that must survive a two-window relative-strength-index. When the one-year bond, equity, and commodity ranking disagrees with the three-month ranking, the live regime is unresolved and the policy-overlay belongs inside market-regime-classification.
- Intermarket-analysis places bonds, equities, and commodities in a lead-lag-sequence instead of judging one market in isolation.
- A relative-strength-index on a one-year window and on a three-month window can disagree; that stage-conflict leaves the live regime unresolved.
- The six-stage map is incomplete for live market-regime-classification because individual cycles differ and because housing, banking, stimulus, debt, and demographic shocks sit outside the textbook diagram.
- A policy-overlay of near-zero rates and repeated easing belongs inside the classification, including when the tape looks like a frozen regime.
Treat the stage label as a hypothesis
In editorial terms, a named cycle stage is a hypothesis, not a finished reading. Market-regime-classification has to survive a two-window relative-strength-index on the same bonds, equities, and commodities. If the one-year ranking and the three-month ranking disagree, the live regime is unresolved.
Intermarket-analysis is the habit of reading those three markets together so one market is placed in a rotating expansion or contraction sequence instead of being judged in isolation. The relative-strength-index is the defined-lookback comparison that shows which market led, lagged, or declined over the sampled interval.
The textbook lead-lag-sequence
Textbook intermarket-analysis has bonds turning ahead of equities and equities turning ahead of commodities on both advances and declines. That order is the lead-lag-sequence.
The stylized cycle is organized as six successive stages that shift accumulation from bonds to equities to commodities and then reverse that order on the way down.
Early-cycle stages are described as a still-contracting economy in which a confirmed bond low is the first rotation, followed by an economic low with equities beginning to follow bonds higher. Mid-cycle stage three is described as a joint advance in bonds, equities, and commodities as expansion continues and inflation starts to appear.
Later stages pair rising policy rates with softer bond prices, then a peak in expansion that the textbook map treats as an argument for reducing equities while commodities are the last class to roll over.
A historical tally of peak-to-peak cycles found an average length measured in several years, with observed cycles ranging from a little over one year to more than a decade.
A one-year window and a three-month window disagreed
The case study treated the stylized six-stage map as incomplete for live market-regime-classification because individual cycles differ and because housing, banking, stimulus, debt, and demographic shocks sit outside the textbook diagram.
Over a one-year relative-strength-index, long-duration domestic bonds led, developed equities trailed that lead, and commodities together with commodity-linked emerging equities were the weakest group. That year-long ranking pointed to a stage-two reading.
The same cross-asset set over a three-month relative-strength-index showed only bonds advancing and equities flat. That shorter window produced a stage-one reading that conflicted with the year-long stage-two reading and with a multi-year equity advance already under way.
In editorial terms, neither window is allowed to cancel the other. A stage-conflict means the live regime stays unresolved until the two relative-strength-index rankings agree.
One-year relative performance of TLT, EMB, SPX, and CRBQ
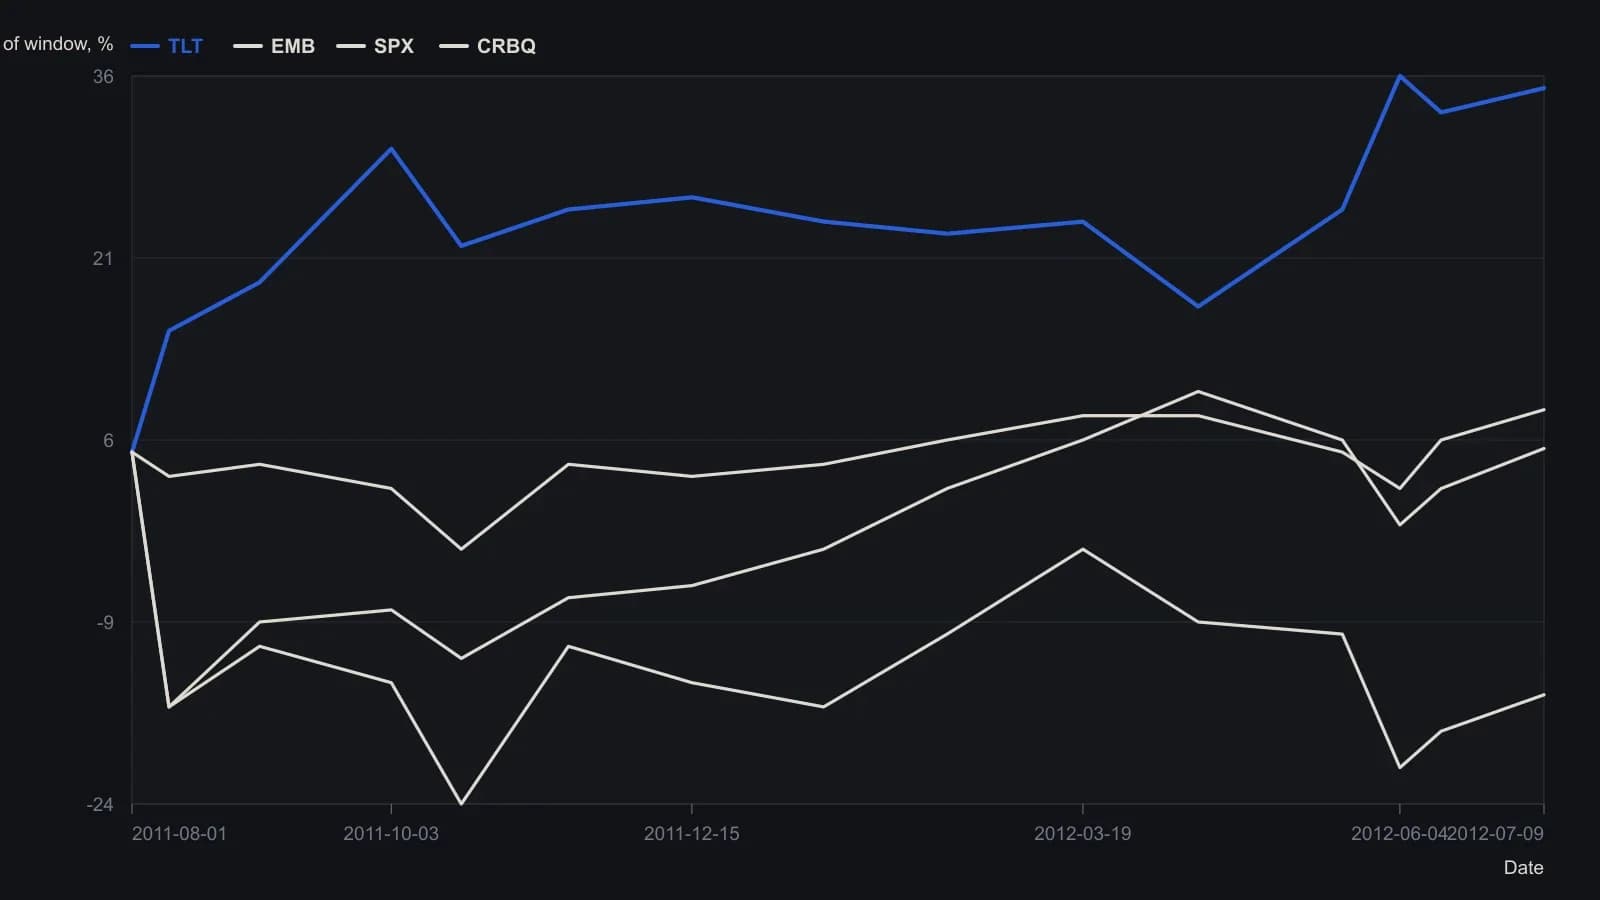
Digitized from the percent-change overlay (2.5-point grid). Readings along the path are rounded to 1 percent and are approximate. The four ending points use the printed labels (+35%, +8.5%, +5.3%, −15%). EEM, which the chart also plots and which finished with CRBQ near −15%, is omitted so the four-series limit can keep US bonds, EM bonds, equities, and commodities.
The policy-overlay is part of the classification
A third classification treated prolonged near-zero policy rates and repeated easing as a possible frozen regime, with later easing episodes described as delivering a smaller equity response than earlier ones in the same sequence.
The policy-overlay is persistent near-zero rates and repeated stimulus that can mute or freeze the usual rotation among the three asset classes. In editorial terms, that overlay belongs inside market-regime-classification rather than beside it. A stage call that cites the lead-lag-sequence but parks policy in a footnote is not a complete reading.
All readings on this track · 21 readings
- 1991A commodity-bond regime check before an equity relative strength index
- 1993A case study in refusing an isolated entry
- 1994The late-bull intermarket clock and regression-channel gates
- 1995Seasonal and political cycle maps as tested abstention regimes
- 2001Year-end high and low as a four-state regime filter
- 2002A six-market moving-average regime map from 2002
- 2003Gold as a regime marker after equity leadership fades
- 2003A four-season regime map before the shorter chart
- 2003From downtrend to trading range: implied volatility and volume after a shock fades
- 2006Exit discipline after regime shocks
- 2006Liquidity, growth, and midcycle market regimes
- 2006Yield-curve spread as an equity regime filter
- 2008Commodity, credit and bond alignment is not a forecast
- 2013Two lookback windows locate the cycle across bonds, stocks, and commodities
- 2014When ranging ends, replace the relative strength index, not its lookback
- 2016A Treasury-high-yield ratio as an equity regime filter
- 2016One-off shocks versus seasonal and secular regimes
- 2018Yield-curve flattening as missing market-regime context
- 2019Classifying six market phases around a single trade
- 2020Evaluating a two-window seasonal equity-bond switch
- 2020Dating energy regime breaks before the trade