1993issue C111-2
Relative momentum construction by stretching the relative strength lookback
The archive specifies a relative momentum construction as a variation of the relative strength index that changes how the price difference is formed. Averaging, the smoothing length, and the bounded scale stay in place while a user-selected comparison interval replaces the one-bar change.
- The relative momentum construction is specified as a variation of the relative strength index that changes how the price difference is formed.
- A user-selected comparison interval replaces the one-bar difference, with a five-bar gap given as the working example.
- Seeded averages are sums of up amounts and down amounts over the smoothing length, each divided by that length; later bars use a length-weighted blend of the prior average and the newest classified amount.
- A daily yen chart note states that the relative strength index path is more volatile than the modified path because the former uses one-day changes and the latter uses five-day changes.
A variation that changes the price difference
The momentum-style series is specified as a variation of the relative strength index that changes how the price difference is formed. The relative strength index is a bounded oscillator that classifies one-bar price changes as up or down amounts and rescales their smoothed averages onto a 0-100 range.
The relative strength index construction begins from a one-bar difference in price. The relative momentum construction keeps those averaging and scaling steps and replaces the one-bar change with a user-chosen gap between two closes.
Setting the comparison interval
The modified construction uses a user-selected number of bars between the two closes being compared. That span is the comparison interval, and a five-bar gap is given as the working example.
Each close-to-close difference over the comparison interval is classified as an up amount or a down amount. The up amount is the non-negative part of the difference. The down amount is the absolute value of a negative difference.
Seeded averages and later updates
Before the bar count reaches the chosen comparison interval, the first up and down averages are seeded averages. Each seeded average is the sum of classified amounts over the stated smoothing length, divided by that length.
On later bars, each average is refreshed as a length-weighted blend of the prior average and the newest classified amount. The smoothing length is the count of classified amounts used to form the first averages and later to weight each recursive update.
The bounded scale
When the two averages are not both zero, the plotted value equals 100 times the up average divided by the sum of the two averages. Otherwise the value is set to 0. That mapping is the bounded scale shared by both constructions.
A reusable function and a plotted series
The construction is intended to be stored as a reusable function and then drawn as an indicator series.
A daily yen path note
A daily yen chart note states that the relative strength index path is more volatile than the modified path because the former uses one-day changes and the latter uses five-day changes.
Daily yen: five-day RMI versus one-day RSI
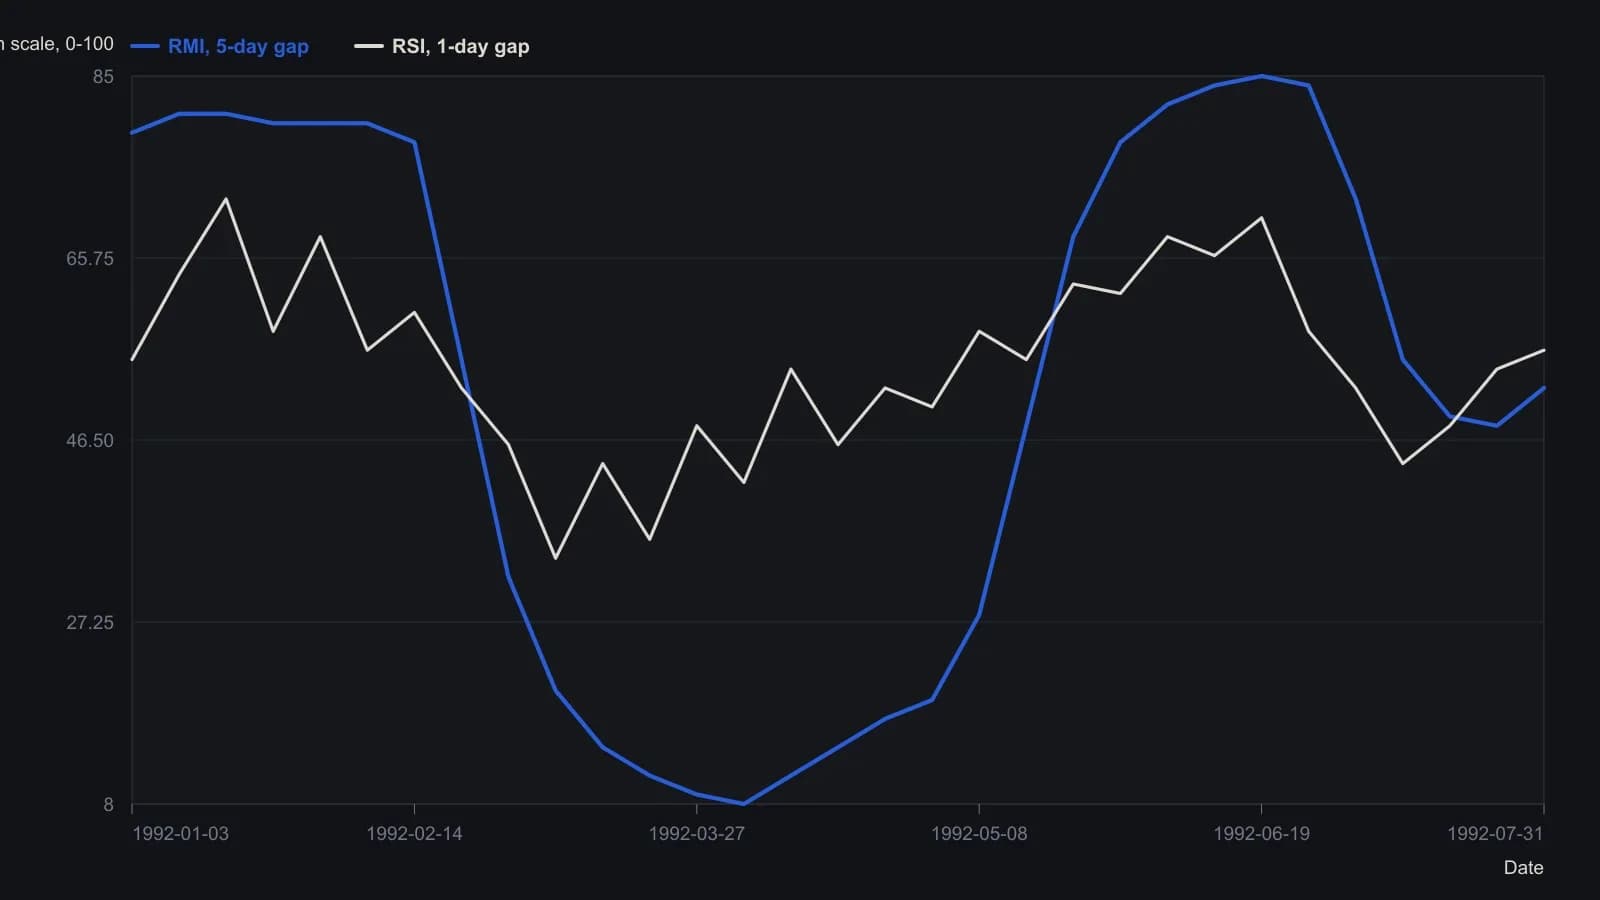
The source builds RMI like RSI but replaces the one-session close-to-close change with a five-session gap; averaging and the 0-100 transform stay the same. Points are whole-number estimates from the raster and are not recomputed indicator output. Visible axis runs January through July 1992.
All readings on this track · 26 readings
- 1991Constructing the relative strength index from seed and recursive averages
- 1991Inverting relative-strength-index closes for same-session rules
- 1991Seeded averages and the recursive-update
- 1993Restating relative-strength-index parameters after a smoothing change
- 1993Relative momentum construction by stretching the relative strength lookback
- 1994Constructing relative strength index lookbacks, bands, and confirmation filters
- 1994Building the relative-strength-index from signed close changes
- 1997Constructing the relative strength index as a bounded up-down close oscillator
- 2002Four-line oscillator construction for rule-based entries
- 2004Assembling a bounded RSI path
- 2004Constructing RSI on highs, lows, and reverse targets
- 2004Reverse-engineered RSI as an explicit next-bar price target
- 2006Self-adjusting RSI thresholds from the oscillator's own spread
- 2006Constructing adaptive overbought and oversold levels for a relative strength index
- 2006Relative Strength Index 50-line entry beyond the 70 and 30 extremes
- 2007Lock a followable rule set before testing RSI exits
- 2008RSI bands as a one-day shift of reverse-engineered levels
- 2008Constructing an asymmetrical RSI from adaptive up and down averages
- 2010Building a bounded oscillator from a rainbow smoother, relative strength, and inverse Fisher
- 2011Two-horizon weekly RSI with moving averages and stops
- 2011Percent-offset simple moving average bands with relative-strength confirmation
- 2011Fast and slow relative strength index as one mechanical rule book
- 2011Price-zone oscillator construction from signed closes
- 2015Constructing a zero-lag oscillator against a relative strength index baseline
- 2015Relative Strength Index as a baseline in 2015 software listings
- 2018Building a Fisherized deviation-scaled oscillator