2010issue C1072-83
Building a bounded oscillator from a rainbow smoother, relative strength, and inverse Fisher
This archive article walks through a bounded oscillator assembled from a rainbow weighted moving average of closes, a short-lookback relative-strength stage, a zero-lag exponential correction, and an inverse Fisher map that is then rescaled to a 0-100 range.
- Raw closes are first replaced by a rainbow weighted moving average built from nested two-bar weighted averages of close, then scaled by descending weights 5 through 1 plus five further nested terms and divided by 20.
- Relative strength is computed on that rainbow series over a default four-bar period and recentered as 0.1 times the oscillator minus 50 so the next stage receives a compact signed input.
- A two-pass exponential moving average of the recentered series, also defaulted to four bars, is combined as the first pass plus the difference of the two passes, then passed through the inverse Fisher map and rescaled onto a 0-100 scale.
- In the supplied implementations, a cross above 12 and a cross below 88 are the coded long and short trigger levels, evaluated next bar at market, and the RSI-period and EMA-period inputs are separately editable with both defaulting to 4.
Four stacked transforms
The construction assembles a bounded oscillator from four successive transforms. A moving average first replaces raw closes with a rainbow-smoothed series. A relative-strength index is then computed on that series. A zero-lag exponential moving average is applied to a recentered form of that oscillator. An inverse Fisher map, followed by a linear rescale, places the finished series on a 0-100 scale.
Here a relative-strength index is a bounded oscillator of average up versus down changes over a stated lookback, applied to a rainbow-smoothed price series rather than raw closes. A moving average is a weighted or exponential average of ordered prices or intermediate series. In this pipeline it is used both as the rainbow pre-smoother and as the zero-lag exponential stage before the inverse Fisher map.
Rainbow weighted average of close
The first stage replaces raw closes with a rainbow weighted moving average. That average is built from nested two-bar weighted averages of close, then scaled by descending weights 5 through 1 plus five further nested terms, all divided by 20.
Relative strength and a compact signed input
Relative strength is computed on that rainbow series over a default four-bar period. The oscillator is then recentered as 0.1 times the oscillator minus 50 so the next stage receives a compact signed input.
Zero-lag exponential correction
A two-pass exponential moving average of that recentered series, also defaulted to four bars, is combined as the first pass plus the difference of the two passes. The combination is the zero-lag exponential value passed to the map.
Inverse Fisher map and the 0-100 scale
The inverse Fisher map y = (exp(2x) - 1) / (exp(2x) + 1) is applied to the zero-lag value. The mapped series is then rescaled by adding 1 and multiplying by 50 so the finished series sits on a 0-100 scale.
Coded trigger levels and editable periods
In the supplied implementations, a cross of the transformed series above 12 and a cross below 88 are the coded long and short trigger levels. Those crossings are evaluated next bar at market in the strategy form.
The same pipeline is parameterized with separately editable RSI-period and EMA-period inputs, both defaulting to 4, so the construction can be rebuilt without changing the transform algebra.
Dow Jones smoothed RSI inverse Fisher, July–November 2009
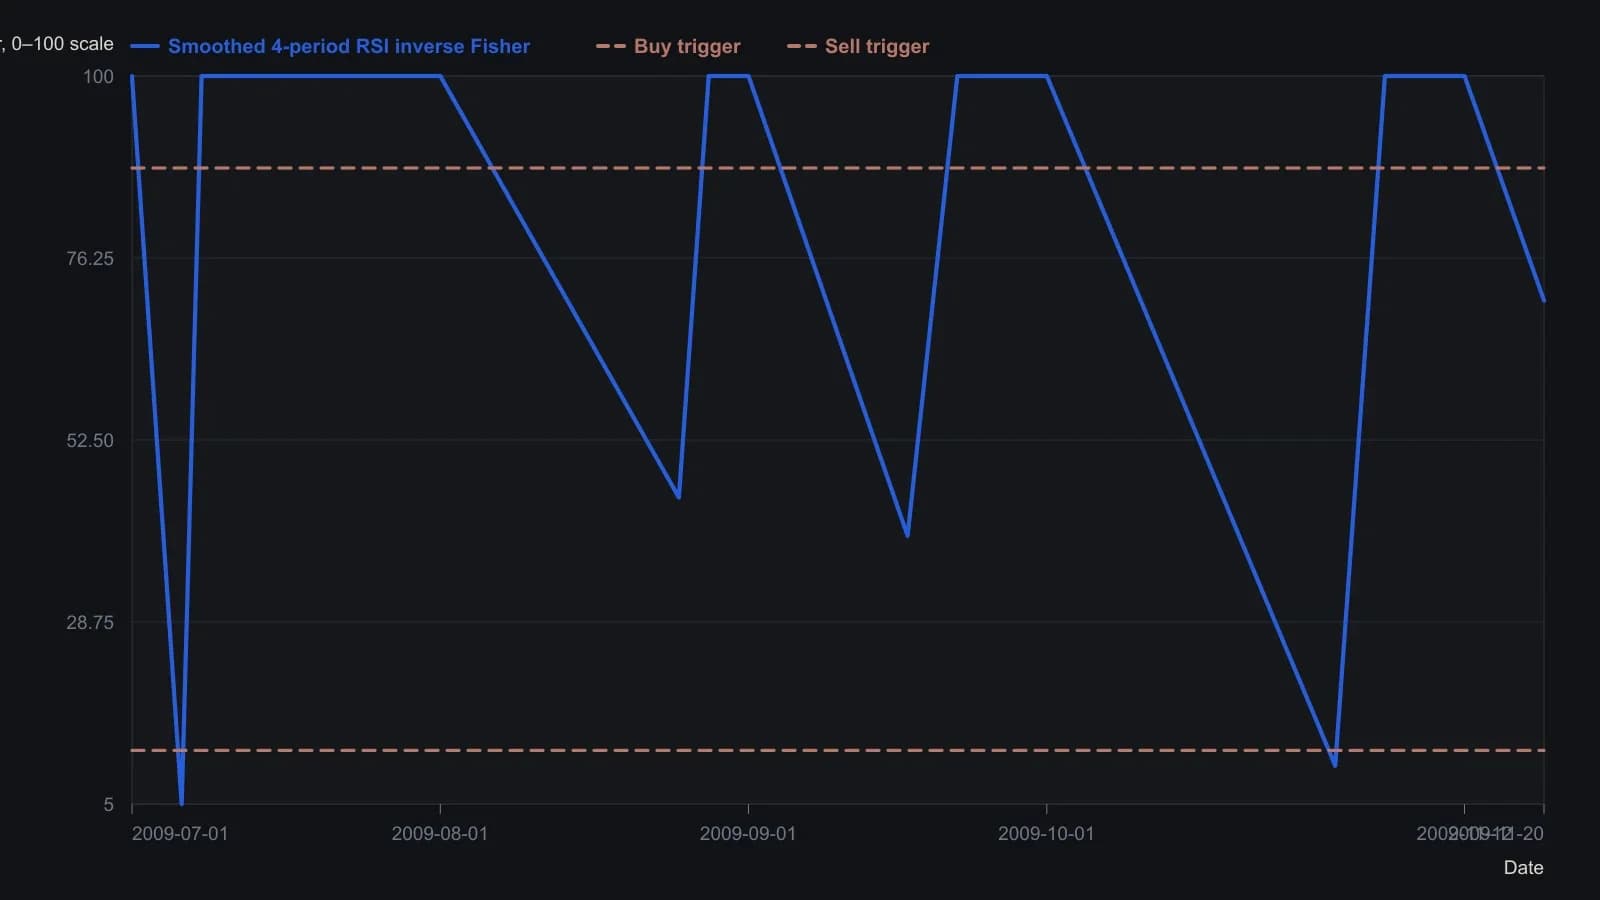
The Updata pane is a 4-period RSI of the rainbow-weighted close, then a 4-period zero-lag EMA, then inverse Fisher rescaled to 0–100. Interior turning-point dates are approximate from the month axis; only the 70.69 finish is a labeled print. Other oscillator readings are raster estimates on a 0–100 scale.
All readings on this track · 26 readings
- 1991Constructing the relative strength index from seed and recursive averages
- 1991Inverting relative-strength-index closes for same-session rules
- 1991Seeded averages and the recursive-update
- 1993Restating relative-strength-index parameters after a smoothing change
- 1993Relative momentum construction by stretching the relative strength lookback
- 1994Constructing relative strength index lookbacks, bands, and confirmation filters
- 1994Building the relative-strength-index from signed close changes
- 1997Constructing the relative strength index as a bounded up-down close oscillator
- 2002Four-line oscillator construction for rule-based entries
- 2004Assembling a bounded RSI path
- 2004Constructing RSI on highs, lows, and reverse targets
- 2004Reverse-engineered RSI as an explicit next-bar price target
- 2006Self-adjusting RSI thresholds from the oscillator's own spread
- 2006Constructing adaptive overbought and oversold levels for a relative strength index
- 2006Relative Strength Index 50-line entry beyond the 70 and 30 extremes
- 2007Lock a followable rule set before testing RSI exits
- 2008RSI bands as a one-day shift of reverse-engineered levels
- 2008Constructing an asymmetrical RSI from adaptive up and down averages
- 2010Building a bounded oscillator from a rainbow smoother, relative strength, and inverse Fisher
- 2011Two-horizon weekly RSI with moving averages and stops
- 2011Percent-offset simple moving average bands with relative-strength confirmation
- 2011Fast and slow relative strength index as one mechanical rule book
- 2011Price-zone oscillator construction from signed closes
- 2015Constructing a zero-lag oscillator against a relative strength index baseline
- 2015Relative Strength Index as a baseline in 2015 software listings
- 2018Building a Fisherized deviation-scaled oscillator