2011issue C0164-71
Two-horizon weekly RSI with moving averages and stops
A slower weekly relative-strength-index, a faster weekly relative-strength-index, a pair of simple moving averages, and two stop treatments can sit on one weekly chart so longer-horizon trend exposure and shorter correction trades share the same transparent rule set.
- Two weekly relative-strength-index readings of different lengths let longer-horizon positions and shorter retracement trades share one chart.
- The longer reading supplies trend direction as an entry filter, and both readings take part in entry and exit conditions.
- A slower and a faster simple moving average of the close sit on the price pane as context for the two oscillator subgraphs.
- Implementations add a percent-stop with a simple size rule or overlay two-stop-level signals so risk stays bounded once a trade is open.
Two weekly oscillators on one chart
The featured rule set is built around two weekly relative-strength-index calculations of different lengths so longer-horizon positions and shorter retracement trades can be handled on one chart.
A relative-strength-index is a bounded oscillator of recent gains versus losses over a chosen lookback. Here a slower weekly reading filters direction and a faster weekly reading times retracement entries and exits.
A five-bar weekly relative-strength-index and a 17-bar weekly relative-strength-index are used together. The longer reading supplies trend direction as an entry filter, and both readings participate in entry and exit conditions.
Google weekly 5-bar and 17-bar RSI
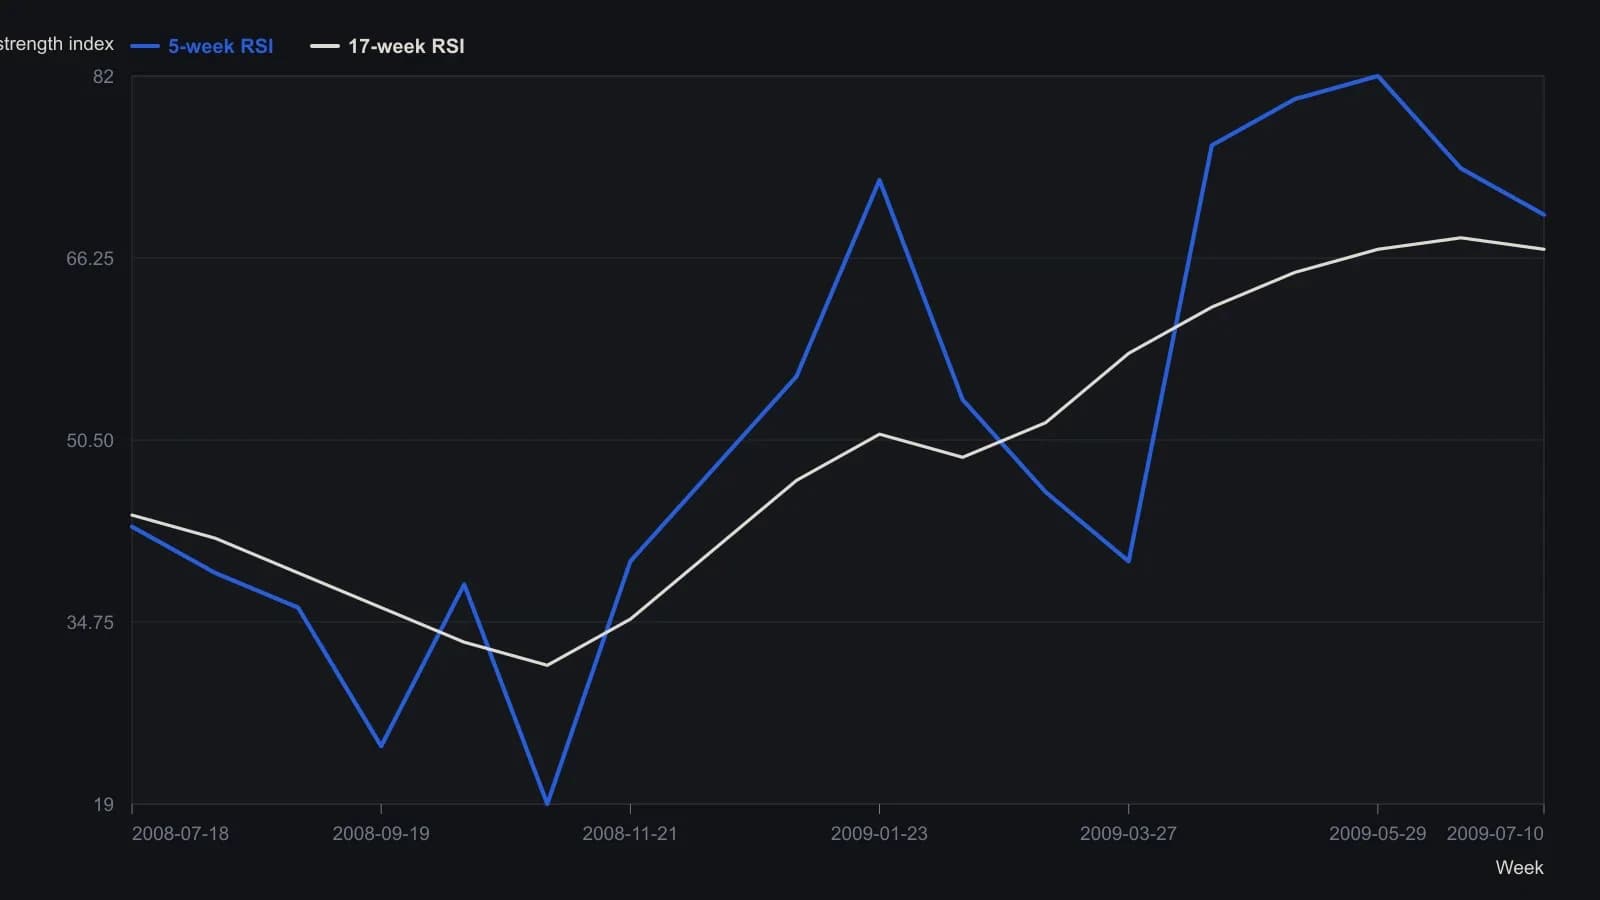
Scrolled weekly window is about July 2008 to July 2009. Status-line prints 92.74 and 68.66 belong to the later live bar, not this view. Guides on the source panes are 40 and 60; price pane also shows 10-week and 40-week simple moving averages. RSI readings are approximate to a few points.
What the design was asked to do
The design requirements call for a single transparent model on weekly data, limited chart-pattern discretion, the ability to stay long in an uptrend while also trading corrections in a downtrend, and a simple implementation.
Moving averages as chart context
A moving average is a smoothed average of closing prices over a stated bar count. A slower and a faster weekly average sit on the same price chart as context for the two-horizon oscillator rules.
A weekly price chart implementation plots a 40-bar simple moving average of the close and a 10-bar simple moving average of the close on the same pane as the two relative-strength-index subgraphs.
Parameters and three ways to mark the rules
A configurable study exposes parameters for the slow and quick relative-strength-index lengths, the slow and quick moving-average lengths, and separate buy and sell levels for each oscillator.
A spreadsheet implementation performs the same oscillator and moving-average calculations in formulas and marks buy and sell points on a candlestick chart that also shows the moving averages.
Another implementation overlays two-stop-level signals from the two-oscillator rule set as green or red dots on the price chart.
How stops sit beside the oscillators
A stop-loss is a pre-set exit that caps loss or exposure once a trade is open. Implementations in this material add a second stop layer or a percent-stop with a simple size rule so risk stays bounded before and during the position.
At least one platform implementation adds a percent-stop system plus a simple position-size rule based on capital, closed equity, and close price.
All readings on this track · 26 readings
- 1991Constructing the relative strength index from seed and recursive averages
- 1991Inverting relative-strength-index closes for same-session rules
- 1991Seeded averages and the recursive-update
- 1993Restating relative-strength-index parameters after a smoothing change
- 1993Relative momentum construction by stretching the relative strength lookback
- 1994Constructing relative strength index lookbacks, bands, and confirmation filters
- 1994Building the relative-strength-index from signed close changes
- 1997Constructing the relative strength index as a bounded up-down close oscillator
- 2002Four-line oscillator construction for rule-based entries
- 2004Assembling a bounded RSI path
- 2004Constructing RSI on highs, lows, and reverse targets
- 2004Reverse-engineered RSI as an explicit next-bar price target
- 2006Self-adjusting RSI thresholds from the oscillator's own spread
- 2006Constructing adaptive overbought and oversold levels for a relative strength index
- 2006Relative Strength Index 50-line entry beyond the 70 and 30 extremes
- 2007Lock a followable rule set before testing RSI exits
- 2008RSI bands as a one-day shift of reverse-engineered levels
- 2008Constructing an asymmetrical RSI from adaptive up and down averages
- 2010Building a bounded oscillator from a rainbow smoother, relative strength, and inverse Fisher
- 2011Two-horizon weekly RSI with moving averages and stops
- 2011Percent-offset simple moving average bands with relative-strength confirmation
- 2011Fast and slow relative strength index as one mechanical rule book
- 2011Price-zone oscillator construction from signed closes
- 2015Constructing a zero-lag oscillator against a relative strength index baseline
- 2015Relative Strength Index as a baseline in 2015 software listings
- 2018Building a Fisherized deviation-scaled oscillator