2002issue C011-7
Four-line oscillator construction for rule-based entries
A single-oscillator plan can replace fixed overbought and oversold thresholds with four parallel reference lines fitted to recent Relative Strength Index extremes and turning areas, then treat those lines as rule-based entry, abstention, and stop-loss order conditions.
- Four-line oscillator construction replaces fixed overbought and oversold thresholds with four parallel reference lines fitted to recent Relative Strength Index extremes and turning areas.
- Fit one extreme range line to highs or lows, draw a parallel opposite extreme, then place two inner turning lines through visible consolidation and reversal clusters.
- Rule-based entry treats a leave of the inner overbought band from above as a short setup and a leave of the inner oversold band from below as a long setup.
- Stop-loss order placement belongs in the same procedure, with candidate protective levels marked for each generated position.
Four-line oscillator construction
A single-oscillator plan can be constructed by replacing fixed overbought and oversold thresholds with four parallel reference lines fitted to recent Relative Strength Index extremes and turning areas.
How the four lines are fitted
The construction sequence is to fit one extreme range line to highs or lows, draw a parallel opposite extreme, then place two inner turning lines through visible consolidation and reversal clusters.
Rule-based entry from the inner bands
Rule-based entry treats a leave of the inner overbought band from above as a short setup and a leave of the inner oversold band from below as a long setup.
A practical fitting window
A practical fitting window used hourly charts over about five to six weeks, then adjusted the same four lines for the following week.
Stop-loss order in the same procedure
Stop-loss order placement was treated as part of the same procedure, with candidate protective levels marked for each generated position.
Signals on other markets and time frames
Hourly tests on four major dollar crosses reported an average of at least one signal per day. The same construction was described as usable on other markets and time frames.
Hourly RSI through the late-January decline and February thrust
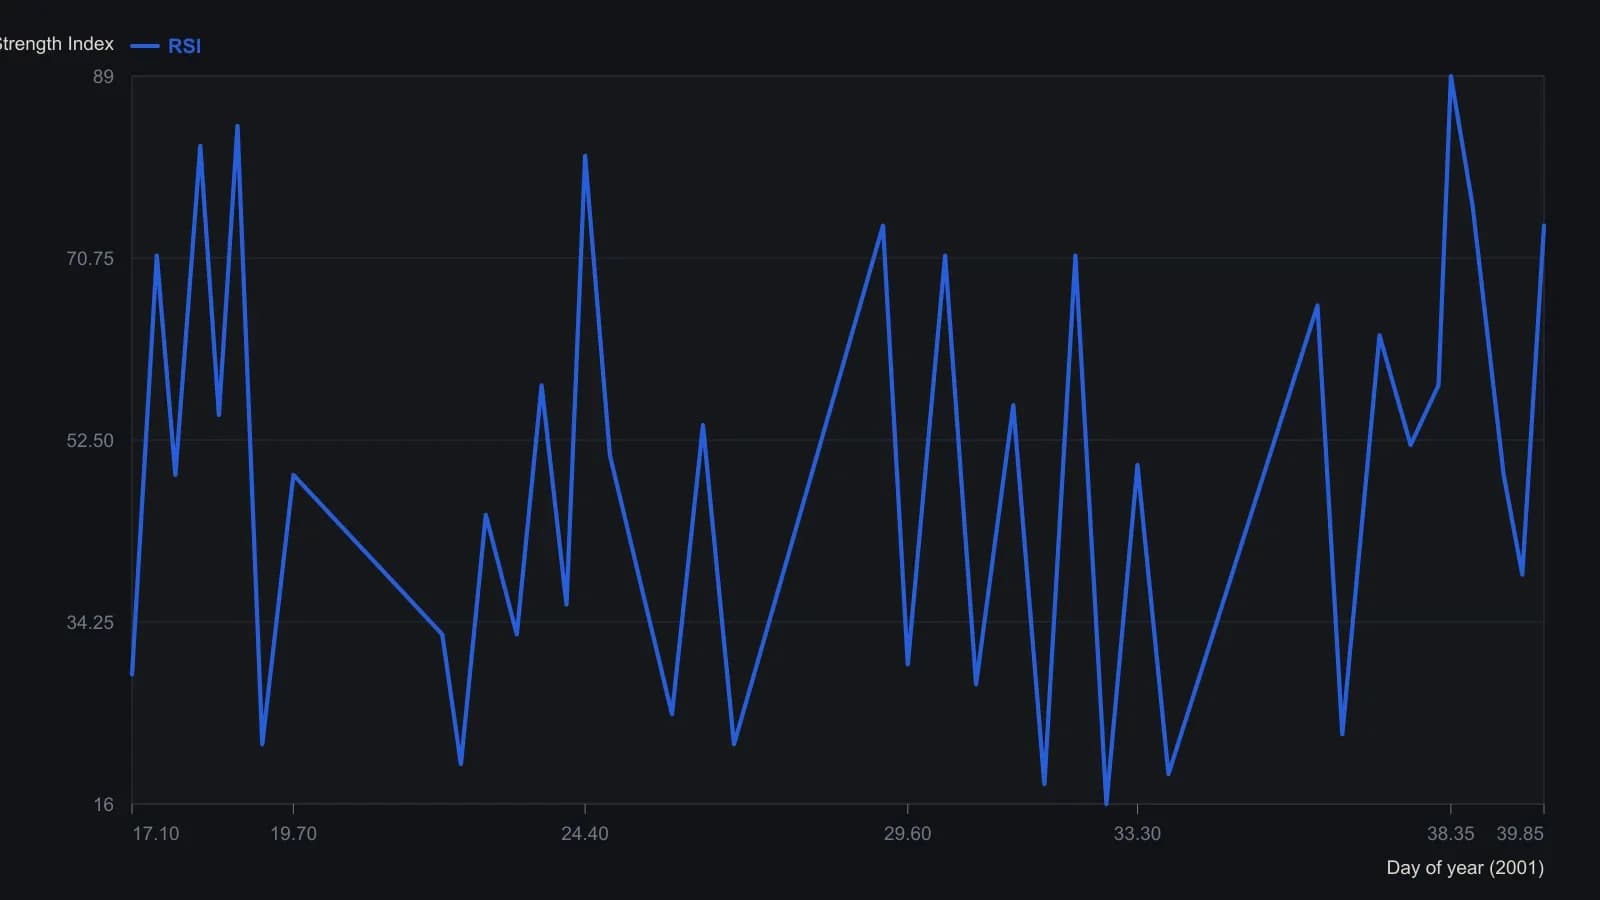
Approximate digitization of the blue oscillator pane. The printed scale is labeled in 10-point RSI steps, so values are given to the nearest point. Horizontal placement follows the axis marks 22, 29, February and 5 in the article’s 2001 example year. Intra-day clock times are not printed, so x is day-of-year with a session fraction.
All readings on this track · 26 readings
- 1991Constructing the relative strength index from seed and recursive averages
- 1991Inverting relative-strength-index closes for same-session rules
- 1991Seeded averages and the recursive-update
- 1993Restating relative-strength-index parameters after a smoothing change
- 1993Relative momentum construction by stretching the relative strength lookback
- 1994Constructing relative strength index lookbacks, bands, and confirmation filters
- 1994Building the relative-strength-index from signed close changes
- 1997Constructing the relative strength index as a bounded up-down close oscillator
- 2002Four-line oscillator construction for rule-based entries
- 2004Assembling a bounded RSI path
- 2004Constructing RSI on highs, lows, and reverse targets
- 2004Reverse-engineered RSI as an explicit next-bar price target
- 2006Self-adjusting RSI thresholds from the oscillator's own spread
- 2006Constructing adaptive overbought and oversold levels for a relative strength index
- 2006Relative Strength Index 50-line entry beyond the 70 and 30 extremes
- 2007Lock a followable rule set before testing RSI exits
- 2008RSI bands as a one-day shift of reverse-engineered levels
- 2008Constructing an asymmetrical RSI from adaptive up and down averages
- 2010Building a bounded oscillator from a rainbow smoother, relative strength, and inverse Fisher
- 2011Two-horizon weekly RSI with moving averages and stops
- 2011Percent-offset simple moving average bands with relative-strength confirmation
- 2011Fast and slow relative strength index as one mechanical rule book
- 2011Price-zone oscillator construction from signed closes
- 2015Constructing a zero-lag oscillator against a relative strength index baseline
- 2015Relative Strength Index as a baseline in 2015 software listings
- 2018Building a Fisherized deviation-scaled oscillator