2018issue C1048-56
Building a Fisherized deviation-scaled oscillator
A Fisherized deviation-scaled oscillator is assembled by forming a two-bar price difference, applying a Super Smoother, rescaling by a lookback root-mean-square, then applying a Fisher transform when the scaled value stays inside an absolute bound of 2. Defaults are a 40-bar lookback and overbought and oversold levels of +2 and -2, with an optional histogram for inspecting the output distribution.
- The oscillator is assembled in order: form a two-bar price difference, apply a Super Smoother, rescale by a lookback root-mean-square, then apply a Fisher transform when the scaled value stays inside an absolute bound of 2.
- Default settings are a 40-bar lookback and overbought and oversold levels of +2 and -2 on the Fisherized output.
- The two-bar difference is described as placing transfer-function zeros at DC and Nyquist so the series is nominally zero-mean and the spectrum is whitened by a 6 dB per octave rolloff.
- An optional sixty-bin histogram spanning roughly -3 to +3 writes counts to a file so the output distribution can be inspected, and a companion strategy exits or reverses on overbought, oversold, and zero crossings.
An ordered construction
A Fisherized deviation-scaled oscillator is assembled by first forming a two-bar price difference, applying a Super Smoother, rescaling the result by a lookback root-mean-square, then applying a Fisher transform when the scaled value stays inside an absolute bound of 2.
The construction uses a default lookback of 40 bars and default overbought and oversold levels of +2 and -2 on the Fisherized output.
A two-bar difference first
The two-bar difference is described as placing transfer-function zeros at DC and Nyquist so the series is nominally zero-mean and the spectrum is whitened by a 6 dB per octave rolloff.
Smooth, then rescale
The Super Smoother coefficients are computed once from the lookback, then used as a three-term recursive filter on the averaged current and prior two-bar differences.
The scale factor is the square root of the mean of squared Super Smoother values over the lookback. The filter output is divided by that factor when the factor is nonzero.
A bounded Fisher transform
The Fisher transform is applied only when the absolute scaled value is less than 2, using one-half the logarithm of (1 plus half the scaled value) over (1 minus half the scaled value).
Inspection and a companion rule set
An optional histogram step counts Fisherized values into sixty bins spanning roughly -3 to +3 and writes the bin counts to a file so the output distribution can be inspected.
A companion strategy formulation exits or reverses when the Fisherized series crosses the overbought or oversold levels and also when it crosses zero.
The same Fisherized oscillator construction is restated as a chart study with a configurable period defaulting to 40 bars.
90% containment bands before and after the Fisher transform
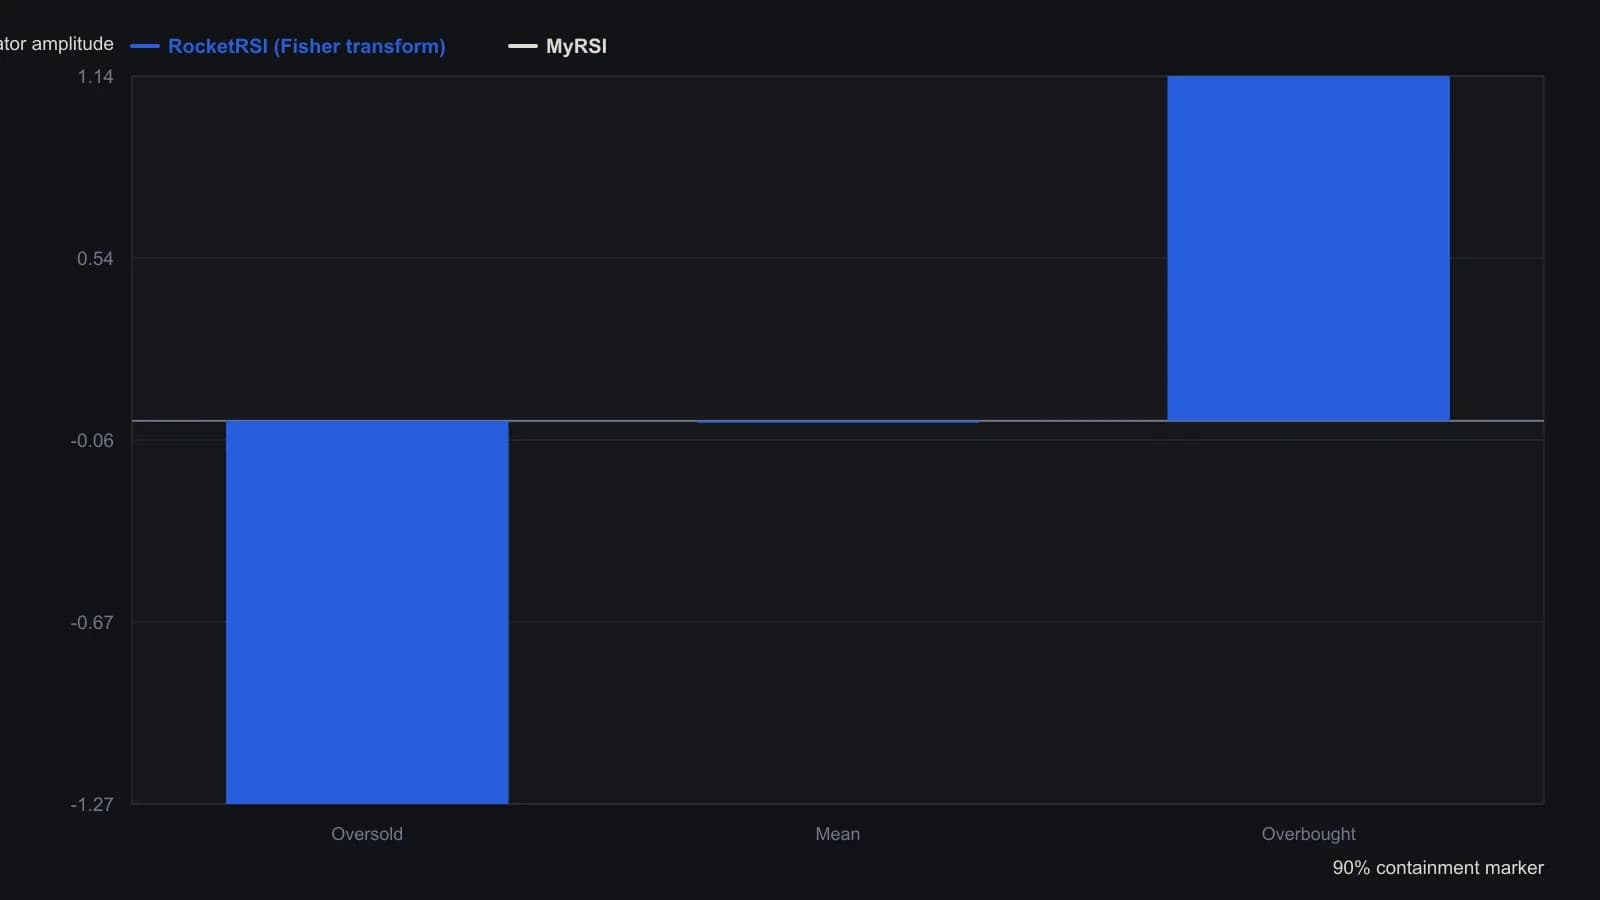
The workbook tallies 1,000 daily bars (about four years), not the 10-year window in Ehlers' original study, so the buckets differ slightly. The published figure profiles MyRSI (length 14) against RocketRSI (length 10); the sheet can switch to the deviation-scaled oscillator, but that is not the pair shown.
All readings on this track · 26 readings
- 1991Constructing the relative strength index from seed and recursive averages
- 1991Inverting relative-strength-index closes for same-session rules
- 1991Seeded averages and the recursive-update
- 1993Restating relative-strength-index parameters after a smoothing change
- 1993Relative momentum construction by stretching the relative strength lookback
- 1994Constructing relative strength index lookbacks, bands, and confirmation filters
- 1994Building the relative-strength-index from signed close changes
- 1997Constructing the relative strength index as a bounded up-down close oscillator
- 2002Four-line oscillator construction for rule-based entries
- 2004Assembling a bounded RSI path
- 2004Constructing RSI on highs, lows, and reverse targets
- 2004Reverse-engineered RSI as an explicit next-bar price target
- 2006Self-adjusting RSI thresholds from the oscillator's own spread
- 2006Constructing adaptive overbought and oversold levels for a relative strength index
- 2006Relative Strength Index 50-line entry beyond the 70 and 30 extremes
- 2007Lock a followable rule set before testing RSI exits
- 2008RSI bands as a one-day shift of reverse-engineered levels
- 2008Constructing an asymmetrical RSI from adaptive up and down averages
- 2010Building a bounded oscillator from a rainbow smoother, relative strength, and inverse Fisher
- 2011Two-horizon weekly RSI with moving averages and stops
- 2011Percent-offset simple moving average bands with relative-strength confirmation
- 2011Fast and slow relative strength index as one mechanical rule book
- 2011Price-zone oscillator construction from signed closes
- 2015Constructing a zero-lag oscillator against a relative strength index baseline
- 2015Relative Strength Index as a baseline in 2015 software listings
- 2018Building a Fisherized deviation-scaled oscillator