2011issue C0663-71
Price-zone oscillator construction from signed closes
This archive article rebuilds the price-zone oscillator as a bounded reading from signed closes, then shows how a shared lookback, a published oscillator-zone map, and a regime-filter turn that reading into named states and rule templates.
- The price-zone oscillator keeps the zone-and-regime idea of the volume-zone oscillator and switches the input series from volume to ordered closes.
- The relative-strength-index-style reading scales a lookback exponential average of signed closes by the same-length exponential average of close, then multiplies by 100, often with a lookback-period of 14.
- A regime-filter that compares close with a 60-period exponential average and a 14-period average directional index with 18 decides which oscillator-zone crossings are active.
- A complete build separates a reusable calculation, a chartable oscillator, and a strategy wrapper, while system reconstructions still have to branch by regime and handle price-oscillator divergence.
A price-domain counterpart
The oscillator is assembled as a price-domain counterpart to a previously published volume-domain oscillator. It keeps the zone-and-regime idea while switching the input series from volume to ordered closes.
One complete build separates the construction into a reusable calculation, a chartable oscillator, and a strategy wrapper that applies the documented rule set.
Signed closes and the shared lookback
A signed-close is a one-bar transform that keeps close when it is above the prior close and negates close when it is below, so a smoother can separate upward and downward price travel.
The relative-strength-index-style formula scales a lookback exponential average of signed closes by the same-length exponential average of close, then multiplies by 100. Several reconstructions use a default averaging length of 14.
The lookback-period is the student-configurable number of bars that sets the exponential averaging horizon for both the signed series and raw close. A watchlist mapping also exposes that lookback as an editable period parameter.
Oscillator zones and named states
Zone guides are specified at plus 60, plus 40, plus 15, 0, minus 5, minus 40, and minus 60. Those oscillator-zone levels turn a continuous reading into crossing events.
A watchlist mapping converts the continuous reading into seven named states: supersold, oversold, negative, flat, positive, overbought, and superbought.
The construction is presented as usable in rising, falling, and sideways regimes, with separate methodologies for each.
TLT 14-day price zone oscillator, July–September 2010
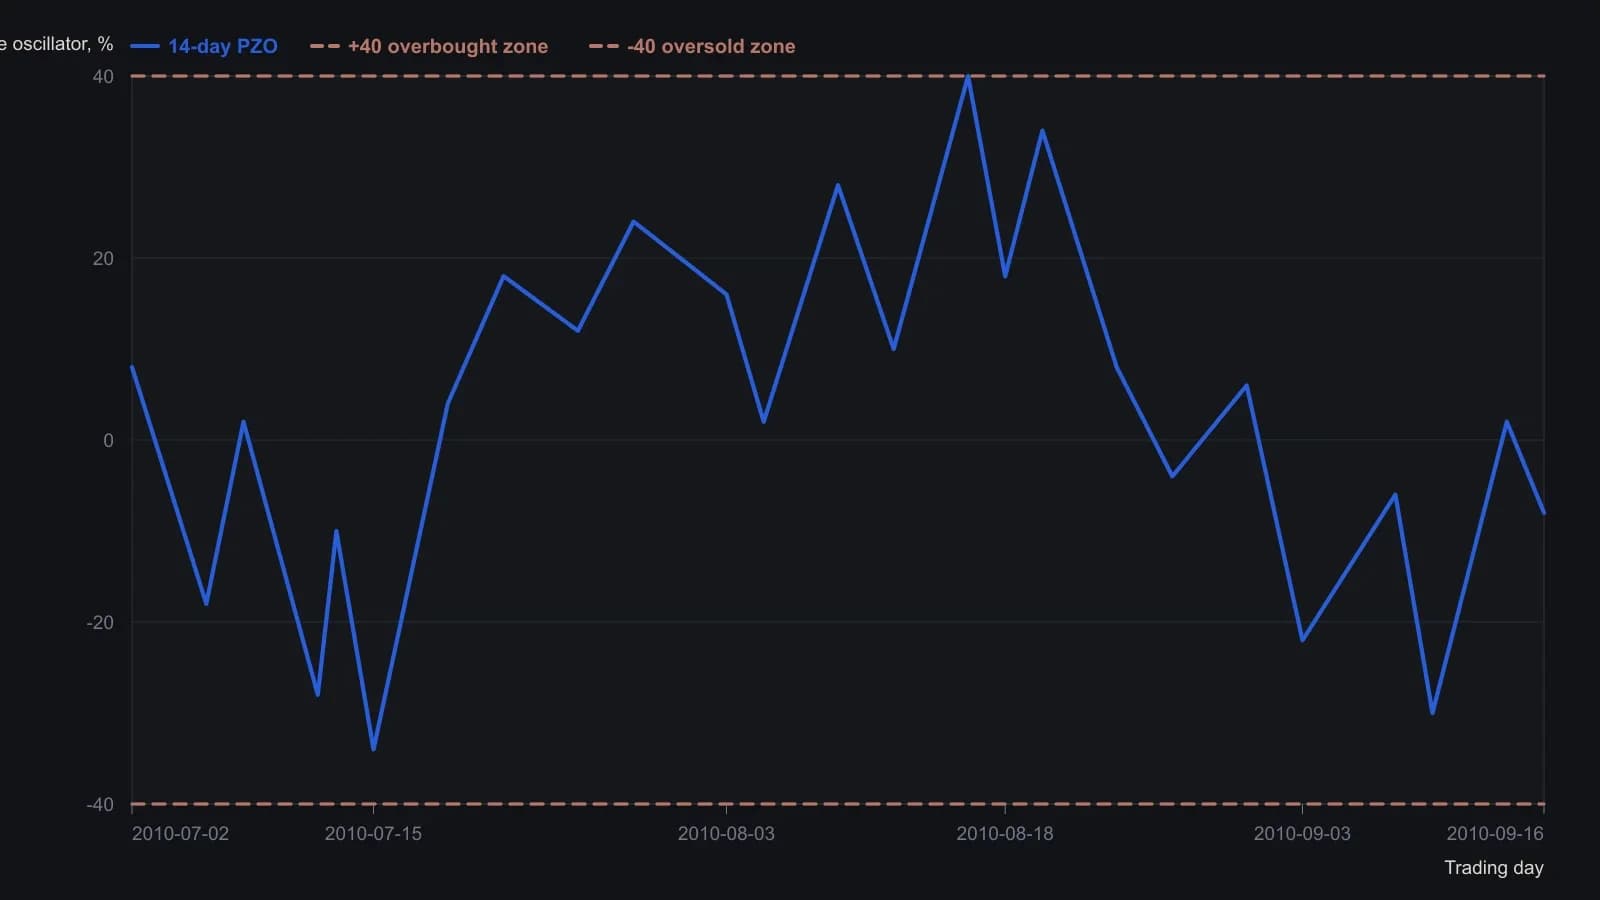
The spreadsheet window is the 53 daily bars the contributor selected (start cell 148) to approximate the authors’ Figure 4. Guides at ±40 are the published zone map. Raster digitisation is approximate to a few oscillator points.
Regime filter and chart companions
Sample charts pair the oscillator with a 60-bar or 60-day exponential average of price and a 14-period average directional index referenced against a horizontal level of 18.
Rule templates change which crossings matter by comparing close with a 60-period exponential average and comparing a 14-period average directional index with 18. The watched levels include minus 40, minus 5, 0, 15, 40, and 60.
A documented downtrend sequence
A documented downtrend sequence treats a drop through 40, price below the 60-day exponential average, and a later move through zero and then under minus 20 as a short-side filter meant to reduce whipsaws. The archive does not confirm an outcome for the illustrated case.
Strategy wrappers and a dual-input toggle
System-style reconstructions are described as more complex than the oscillator itself because they must branch across trending and range-bound regimes and handle both positive and negative price-versus-oscillator divergences. One implementation isolated that logic in a companion library. Another noted that the divergence-exit specification was incomplete.
One dual-input reconstruction lets the same system switch between the price-zone oscillator and the volume-zone oscillator through a single toggle. The rule skeleton can stay fixed while only the input series changes.
All readings on this track · 26 readings
- 1991Constructing the relative strength index from seed and recursive averages
- 1991Inverting relative-strength-index closes for same-session rules
- 1991Seeded averages and the recursive-update
- 1993Restating relative-strength-index parameters after a smoothing change
- 1993Relative momentum construction by stretching the relative strength lookback
- 1994Constructing relative strength index lookbacks, bands, and confirmation filters
- 1994Building the relative-strength-index from signed close changes
- 1997Constructing the relative strength index as a bounded up-down close oscillator
- 2002Four-line oscillator construction for rule-based entries
- 2004Assembling a bounded RSI path
- 2004Constructing RSI on highs, lows, and reverse targets
- 2004Reverse-engineered RSI as an explicit next-bar price target
- 2006Self-adjusting RSI thresholds from the oscillator's own spread
- 2006Constructing adaptive overbought and oversold levels for a relative strength index
- 2006Relative Strength Index 50-line entry beyond the 70 and 30 extremes
- 2007Lock a followable rule set before testing RSI exits
- 2008RSI bands as a one-day shift of reverse-engineered levels
- 2008Constructing an asymmetrical RSI from adaptive up and down averages
- 2010Building a bounded oscillator from a rainbow smoother, relative strength, and inverse Fisher
- 2011Two-horizon weekly RSI with moving averages and stops
- 2011Percent-offset simple moving average bands with relative-strength confirmation
- 2011Fast and slow relative strength index as one mechanical rule book
- 2011Price-zone oscillator construction from signed closes
- 2015Constructing a zero-lag oscillator against a relative strength index baseline
- 2015Relative Strength Index as a baseline in 2015 software listings
- 2018Building a Fisherized deviation-scaled oscillator