1997issue C091-3
Constructing the relative strength index as a bounded up-down close oscillator
The relative strength index is a 0 to 100 oscillator built from averaged upward and downward close-to-close changes. This editorial construction lab rebuilds the relative-strength ratio, the corridor-fold, and recursive-smoothing so that lookback and rail placement can be seen as design choices that make swing setups readable while a persistent trend can pin the line at the edges.
- The relative strength index is built by averaging close-to-close upward and downward changes over a lookback, forming an unbounded relative-strength ratio, and applying a corridor-fold that maps that ratio onto a fixed 0 to 100 interval.
- After the first window, recursive-smoothing updates each average from the prior average, the newest matching change, and the lookback; lookback itself is an experience choice, with a 14-period window offered for many futures series and a 21-period window for many equities.
- Readings beyond the 70 and 30 excursion-thresholds are framed as setups near possible tops and bottoms, and divergence can show fading pressure even while price prints a new extreme, without being described as infallible.
- A persistent trend can hold the line in a pinned-bound state near or outside those rails, including an 82 reading on a strong breakout, so the construction that isolates swings is a poor standalone tool for trading the trend itself.
A bounded oscillator from up and down closes
As a TradersWeek editorial frame, the relative strength index is taught here as a construction lab for a bounded oscillator rather than as a finished trading rule.
The relative strength index is constructed as a bounded oscillator that can occupy any value from 0 to 100 and typically remains between 20 and 80.
Construction begins by averaging close-to-close upward changes and close-to-close downward changes over a lookback, then dividing the up average by the down average to form an unbounded relative-strength ratio.
Folding the ratio into a fixed corridor
That ratio is then compressed onto the 0 to 100 interval by subtracting, from 100, the quantity 100 divided by one plus the ratio. The corridor-fold is this mapping from an unbounded relative-strength ratio onto a fixed 0 to 100 interval.
When up and down changes balance around a price level, the line tends toward a neutral-value near 50, the mid-corridor reading of the same fold.
Updating the averages after the first window
After the first window, each average is updated by recursive-smoothing. The prior up or down average is multiplied by one less than the lookback, the newest matching change is added, and the sum is divided by the lookback.
Lookback length is treated as an experience choice rather than a unique constant. A 14-period window is offered for many futures series and a 21-period window for many equities, with a theoretical preference for about half a cycle of the series.
How the finished line is read
Readings beyond 70 and 30 are framed as setups near possible tops and bottoms. Those excursion-thresholds sit at the construction level as setup zones rather than automatic turning commands.
The same construction is also read with line-only chart formations and with divergence, a disagreement between successive oscillator highs or lows and the corresponding price highs or lows.
Divergence can show that downside or upside pressure is fading even while price still prints a new extreme. The implied shift may be from directional to flat rather than an immediate reversal, and the indication is not described as infallible.
A single corridor path and a pinned bound
The finished line discards highs, lows, gaps, and price formations so that only a single corridor-bounded path remains. The direction of that path is read as a compact cue to the price trend implied by the chosen lookback.
Because the line is bounded, a persistent trend can leave it in a pinned-bound state near or outside the 30 and 70 rails, including an 82 reading on a strong breakout, while price continues. The same construction that isolates swings is a poor standalone tool for trading the trend itself.
Fourteen-day RSI on September 1997 Treasury bond futures
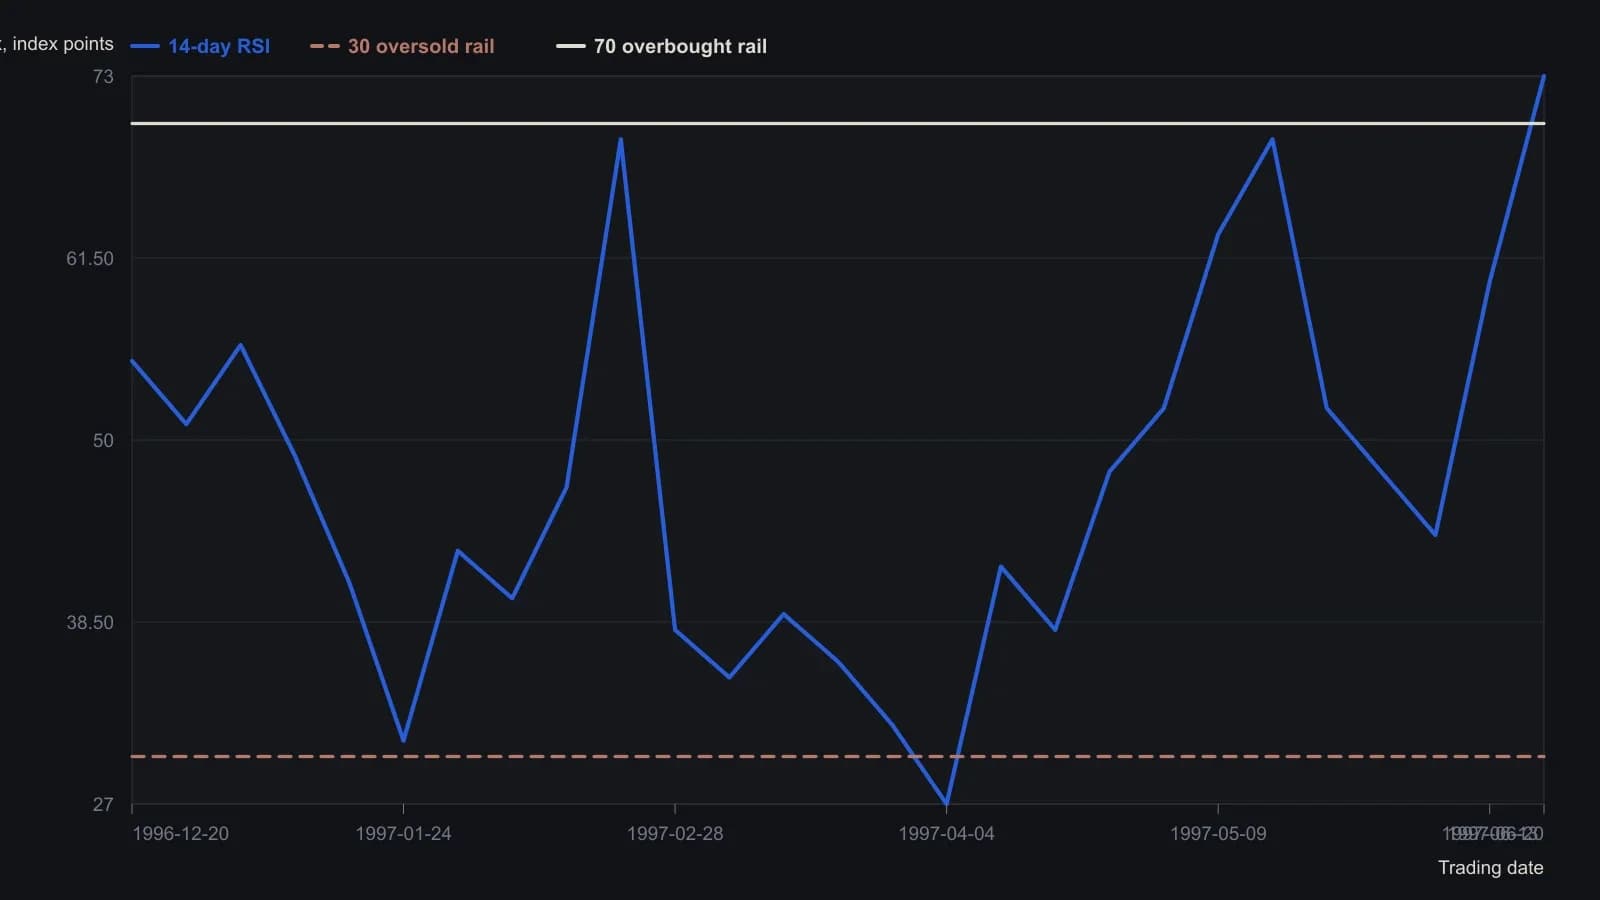
Wilder 14-day lookback of close-to-close up and down averages, folded by RSI = 100 − 100/(1+RS). Digitized from a 1997 screenshot, so individual points are only good to a few index units. Sweeney drops point D because the May pullback never approached 30.
All readings on this track · 26 readings
- 1991Constructing the relative strength index from seed and recursive averages
- 1991Inverting relative-strength-index closes for same-session rules
- 1991Seeded averages and the recursive-update
- 1993Restating relative-strength-index parameters after a smoothing change
- 1993Relative momentum construction by stretching the relative strength lookback
- 1994Constructing relative strength index lookbacks, bands, and confirmation filters
- 1994Building the relative-strength-index from signed close changes
- 1997Constructing the relative strength index as a bounded up-down close oscillator
- 2002Four-line oscillator construction for rule-based entries
- 2004Assembling a bounded RSI path
- 2004Constructing RSI on highs, lows, and reverse targets
- 2004Reverse-engineered RSI as an explicit next-bar price target
- 2006Self-adjusting RSI thresholds from the oscillator's own spread
- 2006Constructing adaptive overbought and oversold levels for a relative strength index
- 2006Relative Strength Index 50-line entry beyond the 70 and 30 extremes
- 2007Lock a followable rule set before testing RSI exits
- 2008RSI bands as a one-day shift of reverse-engineered levels
- 2008Constructing an asymmetrical RSI from adaptive up and down averages
- 2010Building a bounded oscillator from a rainbow smoother, relative strength, and inverse Fisher
- 2011Two-horizon weekly RSI with moving averages and stops
- 2011Percent-offset simple moving average bands with relative-strength confirmation
- 2011Fast and slow relative strength index as one mechanical rule book
- 2011Price-zone oscillator construction from signed closes
- 2015Constructing a zero-lag oscillator against a relative strength index baseline
- 2015Relative Strength Index as a baseline in 2015 software listings
- 2018Building a Fisherized deviation-scaled oscillator