2004issue C051-10
Assembling a bounded RSI path
A five-bar RSI of midpoint price is recentered by subtracting 50 and scaled by 0.1, then passed through a nine-bar weighted average and mapped as (exp(2x)-1)/(exp(2x)+1). Entries fire when that mapped series crosses 0.5 or -0.5.
- Relative strength index is a bounded oscillator of ordered closes that is recentered, smoothed, and then passed through a hyperbolic mapping before a level is crossed.
- The RSI path recenters a five-bar RSI of midpoint price by subtracting 50 and scaling by 0.1 before a nine-bar weighted average.
- The mapped RSI series is formed as (exp(2x)-1)/(exp(2x)+1) from that weighted average.
- Entries fire when the mapped RSI series crosses 0.5 or -0.5, with the opposite pair used for short exits.
The historical workflow
In this historical workflow, relative strength index is a bounded oscillator of ordered closes that is recentered, smoothed, and then passed through a hyperbolic mapping before a level is crossed.
The path is built from named steps in order. Each step takes the series from the step before it.
Assemble the RSI path
Begin with midpoint price and form a five-bar RSI.
Recenter that RSI by subtracting 50, then scale the recentered values by 0.1.
Pass the scaled series through a nine-bar weighted average. That weighted average is the input to the next step.
Form the mapped series
From that weighted average, form the mapped RSI series as (exp(2x)-1)/(exp(2x)+1).
The mapped series is the series that is later compared with a level.
Read the crossings
Entries fire when the mapped RSI series crosses 0.5 or -0.5, with the opposite pair used for short exits.
QQQ daily inverse Fisher RSI with 0.5 trigger lines
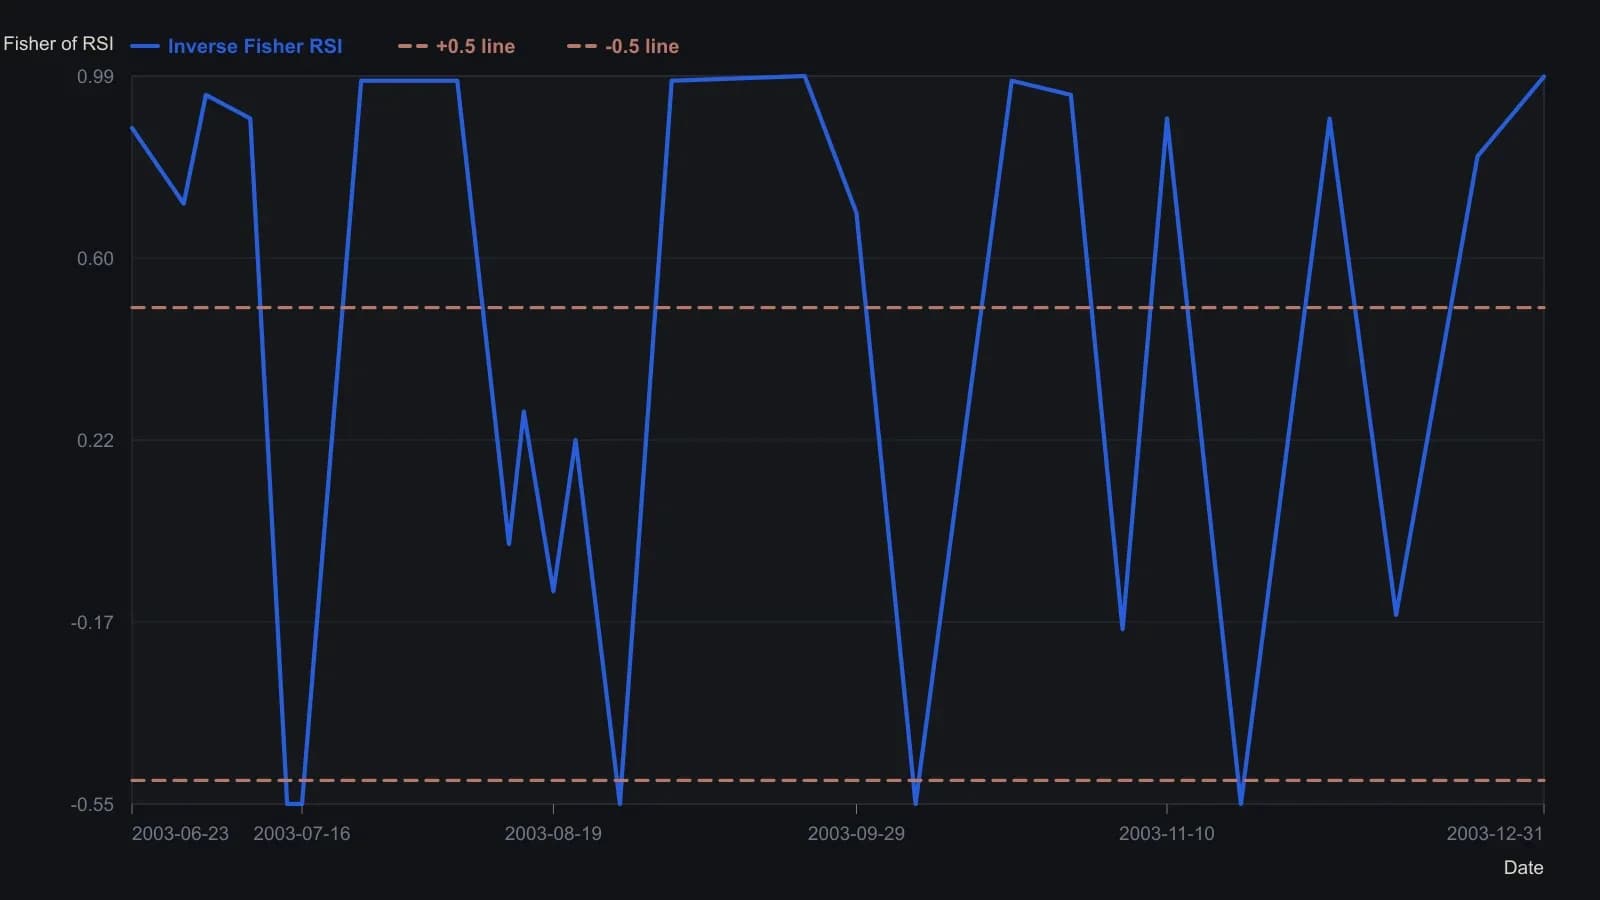
Construction in the demo is a 5-bar RSI, recenter by subtracting 50, scale by 0.1, then a 9-bar weighted average before the inverse Fisher map. All y values except the printed 0.989 are approximate reads from the plot grid.
All readings on this track · 26 readings
- 1991Constructing the relative strength index from seed and recursive averages
- 1991Inverting relative-strength-index closes for same-session rules
- 1991Seeded averages and the recursive-update
- 1993Restating relative-strength-index parameters after a smoothing change
- 1993Relative momentum construction by stretching the relative strength lookback
- 1994Constructing relative strength index lookbacks, bands, and confirmation filters
- 1994Building the relative-strength-index from signed close changes
- 1997Constructing the relative strength index as a bounded up-down close oscillator
- 2002Four-line oscillator construction for rule-based entries
- 2004Assembling a bounded RSI path
- 2004Constructing RSI on highs, lows, and reverse targets
- 2004Reverse-engineered RSI as an explicit next-bar price target
- 2006Self-adjusting RSI thresholds from the oscillator's own spread
- 2006Constructing adaptive overbought and oversold levels for a relative strength index
- 2006Relative Strength Index 50-line entry beyond the 70 and 30 extremes
- 2007Lock a followable rule set before testing RSI exits
- 2008RSI bands as a one-day shift of reverse-engineered levels
- 2008Constructing an asymmetrical RSI from adaptive up and down averages
- 2010Building a bounded oscillator from a rainbow smoother, relative strength, and inverse Fisher
- 2011Two-horizon weekly RSI with moving averages and stops
- 2011Percent-offset simple moving average bands with relative-strength confirmation
- 2011Fast and slow relative strength index as one mechanical rule book
- 2011Price-zone oscillator construction from signed closes
- 2015Constructing a zero-lag oscillator against a relative strength index baseline
- 2015Relative Strength Index as a baseline in 2015 software listings
- 2018Building a Fisherized deviation-scaled oscillator