202040-43
When a breakdown fails by one box, treat it as a regime filter
The archive FB window shows a double-bottom sell that reversed after exactly one extra box. TradersWeek editorial reading is that the task is not to name the bear trap, but to choose among a weeks-to-months regime test, a delayed-exit procedure, and a confirmation veto.
- A bear-trap reading is allowed only when the breakdown column of Os extends exactly one box below the prior O-column and then reverses into Xs.
- Seasonal analysis treats that failure as a market-regime test: a durable weeks-to-months shift versus a brief trap around a single name.
- If the sell signal is taken, the delayed-exit rule waits for a later buy signal, because a second O-column is not known in advance to reverse.
- A confirmation veto on an overlapping daily candlestick window can set the point-and-figure reversal aside when upside follow-through looks weak.
The work is the choice, not the name
When a double-bottom breakdown fails after a single extra box, the archive method can label it a bear trap. TradersWeek editorial reading is that the label is not the decision. The same one-box failure can test a weeks-to-months regime reading, start a delayed-exit procedure, or be set aside when a second chart scale fails to confirm.
How the archive defines the signals
In the illustrated point-and-figure method, a double-top breakout occurs when an X-column exceeds the prior X-column high, with an O-column between them. A double-bottom breakdown occurs when an O-column moves below the prior O-column, with an X-column between them, and is treated as a sell signal.
A bear trap is specified only when that breakdown extends exactly one box below the prior O-column and then reverses into Xs. A deeper extension cancels the trap reading. Under the one-box rule, only that exact depth allows the failed-breakdown interpretation.
The FB window in fall 2019
The FB case is placed in fall 2019 and shows an O-column one box below the prior O-column, followed by an upside reversal into Xs. In the same illustration, a bullish follow-through was marked when the latest X-column closed above the prior X-column.
If a later O-column then breaks below the prior O-column, a catapult can form and the bear-trap reading is negated. That later break is the catapult-invalidation of the failed-breakdown interpretation.
Read the episode as a regime test
Seasonal analysis, in the sense used here, reads the failed-breakdown episode as a market-regime test. The question is whether nearby price action is a durable weeks-to-months shift or only a brief trap around a single name. TradersWeek editorial view is that meeting the one-box rule does not, by itself, upgrade the regime. It only qualifies the episode for that test.
Encode sell, wait, and abstention as one procedure
Because the second O-column cannot be known in advance to reverse, the described procedure may take the sell signal and wait for a later buy signal before exiting. Seasonal trading encodes that sell signal, the later opposite-signal exit, and abstention when confirmation is weak as one procedure whose holding period is set by the system rather than by hindsight.
The delayed-exit rule follows from that limit. If the breakdown signal is taken, the short is not assumed to be a trap until a later buy signal appears, because the reversal is not knowable in real time.
Check the same window on a second scale
Seasonal chart pattern work defines the one-box double-bottom failure on a point-and-figure grid, then checks the same window on an OHLC candlestick scale so the pattern can be kept or discarded. An overlapping daily candlestick window of FB showed a break of two prior lows that reversed back above support and then met resistance at a 50-day moving average.
That second-scale check was used to treat the point-and-figure signals as weak and to prefer waiting, or standing aside, until structure was more aligned. That is the confirmation-veto: stand aside when the point-and-figure reversal is present but upside follow-through looks unconvincing.
Facebook share price around the failed August 2019 breakdown
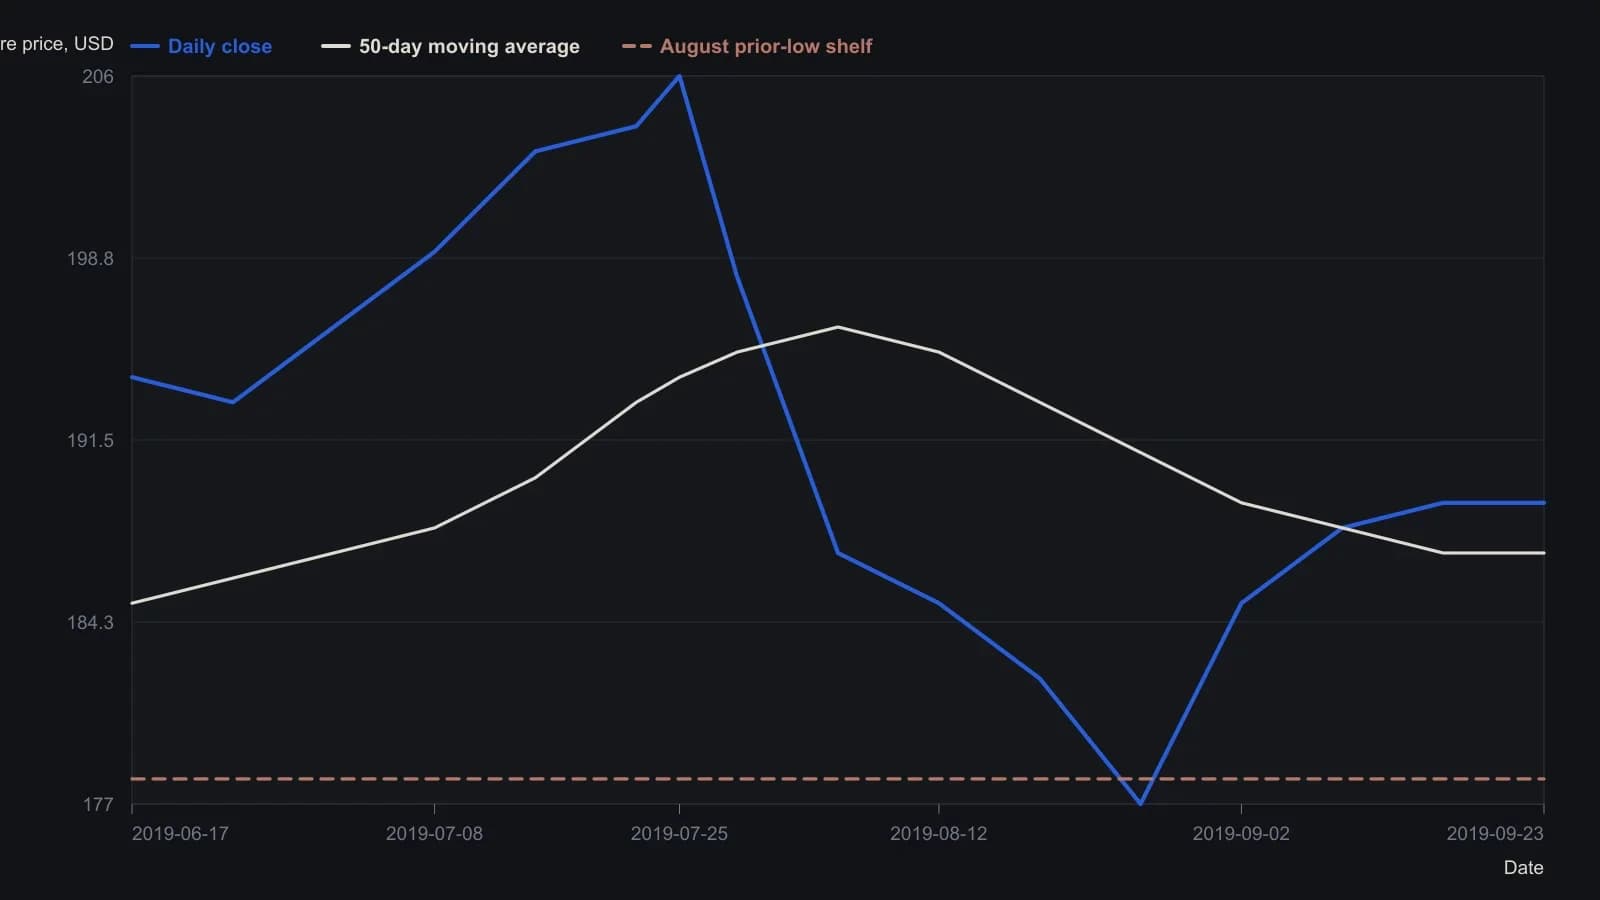
Digitized from the raster, so prices are approximate to about one dollar. The 50-day average is the overlay on the source pane; the horizontal shelf is the guide drawn through the August lows that the green breakdown arrow marks.
All readings on this track · 16 readings
- 1989Weekday price paths are regime-dependent
- 1990The January barometer as a rest-of-year scoring problem
- 1990Calendar windows as testable index-futures procedures
- 1991Testing the July-August summer rally as an occurrence count
- 1996Nested calendar clocks in long-bond futures
- 2006Stacking one-session calendar filters on index regimes
- 2008The January effect as a short window versus the month
- 2012A seasonal window still needs regime and chart confirmation
- 2013Calendar seasonality as a regime filter, not a standalone signal
- 2016A monthly seasonal heatmap as a three-gate regime filter
- 2016Payroll windows and settlement regimes
- 2017Memorial Day seasonal windows across equity, rates, and euro
- 2018Month-turn window, posture, and an open menu
- 2019Monthly FX regimes as three-state stances
- 2019Seasonal windows inside renewable cost regimes
- 2020When a breakdown fails by one box, treat it as a regime filter