2016issue C0245-47
A monthly seasonal heatmap as a three-gate regime filter
A monthly date-colored calendar isolated date-linked clusters, then showed each name’s trade window against yearly outcome bars. An editorial reading uses that stack as three gates: isolate the cluster, inspect the same window year by year, and only then let the month’s calendar heat act as a regime vote.
- A date-linked cluster is a historically repeating directional move tied to a calendar date or short window, not to a headline.
- Yearly outcome bars and a chart drill-down keep one unusual year from standing in for the pattern.
- Calendar heat records how one-sided a day’s past sessions were and is a backdrop, not a single-name forecast.
- An editorial regime vote reads the month’s green-red mix to confirm, delay, or force abstention on that one setup.
A calendar of date-linked clusters
A monthly calendar was filled with equities and funds that had historically repeated a directional move on a given date or short window. The screened set was described as about 250 stocks and funds chosen for those consistent date-linked moves.
Those seasonal projections were formed with a look-ahead of about 30 days. Each calendar day was colored so that deeper green or red marked a more one-sided historical bullish or bearish session. That color depth is the calendar heat on the month.
From a date to a trade window
Choosing a date opened a candidate list split into bullish and bearish rows. The rows could be sorted by historical profit, accuracy, average profit, and the window’s end date.
Selecting a symbol showed the implied buy and sell dates together with a 10-year bar chart of that same window’s yearly results. The implied dates define the trade window. The multi-year display is the set of yearly outcome bars.
An unusually large or small yearly bar could be opened as that year’s price chart so the actual path of the seasonal window could be inspected. That inspection is the chart drill-down.
Three gates around one setup
In this editorial reading, the same archive tools are used as a three-gate procedure. The first gate isolates a date-linked cluster: a historically repeating directional move tied to a calendar date or short window rather than to a headline.
The second gate stays on that trade window and reads the yearly outcome bars so a mixed record is visible before any single year is treated as the pattern. A chart drill-down on an unusually large or small bar asks whether that year’s price path still looks like a repeatable chart structure. One standout year is not allowed to carry the idea.
Only then does the third gate open. The month’s green-red mix is read as a regime vote that may confirm, delay, or force abstention on that single setup.
The month as a regime vote
The archive treated the month’s mix of colors as a market-regime backdrop, including around scheduled policy events, rather than as a single-name forecast alone.
A greener monthly map was read as a cue for an upside equity-index regime. A redder or more mixed map was read as a reason not to assume that backdrop.
The editorial use of that backdrop is limited. Calendar heat can support the isolated setup, postpone it, or argue for staying out. It does not replace the yearly check, and it does not turn every name on the day’s list into the same decision.
Bullish versus bearish share on the January 2016 Money Calendar
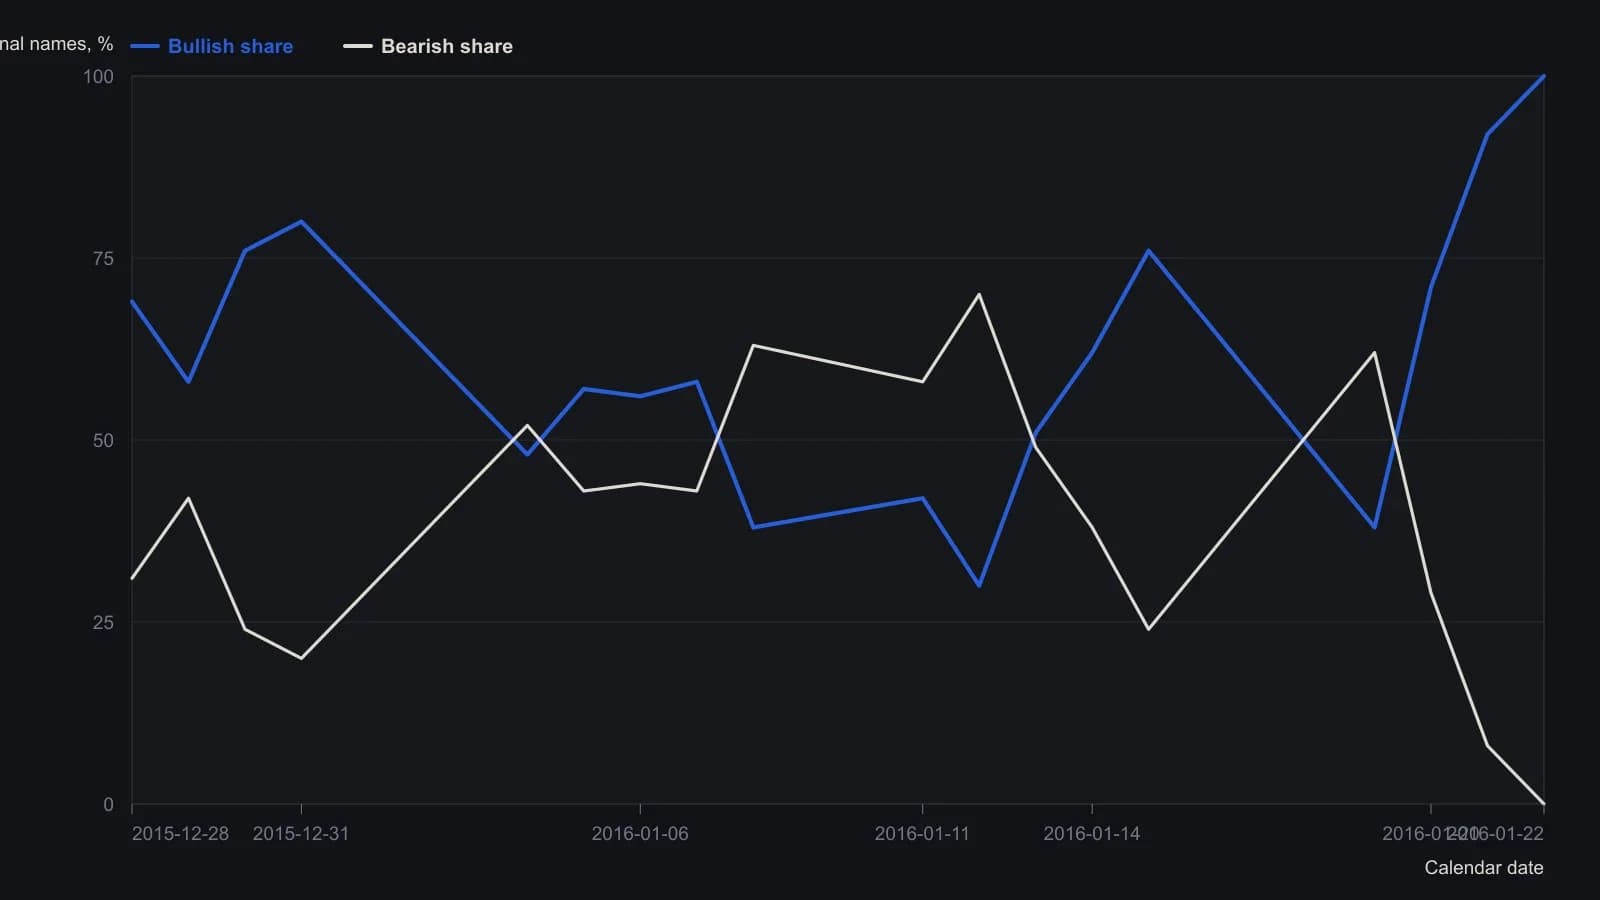
Only days that the product filled with high-probability seasonal names are plotted. Empty weekend and holiday cells, including 1 January and 18 January, are omitted. Printed percents are used as shown; on a few days they round so the two shares do not sum to 100.
All readings on this track · 16 readings
- 1989Weekday price paths are regime-dependent
- 1990The January barometer as a rest-of-year scoring problem
- 1990Calendar windows as testable index-futures procedures
- 1991Testing the July-August summer rally as an occurrence count
- 1996Nested calendar clocks in long-bond futures
- 2006Stacking one-session calendar filters on index regimes
- 2008The January effect as a short window versus the month
- 2012A seasonal window still needs regime and chart confirmation
- 2013Calendar seasonality as a regime filter, not a standalone signal
- 2016A monthly seasonal heatmap as a three-gate regime filter
- 2016Payroll windows and settlement regimes
- 2017Memorial Day seasonal windows across equity, rates, and euro
- 2018Month-turn window, posture, and an open menu
- 2019Monthly FX regimes as three-state stances
- 2019Seasonal windows inside renewable cost regimes
- 2020When a breakdown fails by one box, treat it as a regime filter