1992issue C041-8
Inner planet cycle dates, seasonal inversions, and stochastic timing
This archive note treats inner-planet event dates, a seasonal-sketch, and a stochastic-oscillator as three separate jobs: book a watch date, map phase and inversion-markers, then allow a timed signal only from the oscillator inside that window.
- A dominant-cycle date, including a planetary-eclipse of Mercury or Venus, nominates a possible high or low and does not specify path or magnitude.
- A seasonal-sketch marks those dates, places inversion-markers one-half or one-third of the way between them, and draws a phase path; it does not issue an entry or exit.
- Editorial reading: a stochastic-oscillator is the only layer allowed to issue a timed signal, and only inside the nominated cycle window.
- An aspect-score entered a majority tally only after later price change cleared a stated 70 percent case threshold; weaker cases were treated as insignificant.
A three-layer checklist
The archive presented natural-cycle dates as timing hypotheses meant to be combined with conventional technical tools rather than applied in isolation. Editorial reading organizes that combination as three layers with separate jobs.
The first layer is a dominant-cycle date. It only books a watch mark. The second layer is a seasonal-sketch. It only maps phase and mid-interval inversion-markers. The third layer is a stochastic-oscillator. It is the only layer allowed to issue a timed signal.
Book a watch date, not a path
A dominant-cycle is a recurring natural interval whose event dates nominate possible highs or lows without specifying path or magnitude. Inferior conjunctions of Mercury and Venus were treated as candidate dominant-cycle dates.
A planetary-eclipse is an inferior conjunction in which Mercury or Venus stands between Earth and the Sun and is treated as a calendar cycle event. In one historical equity study those Mercury dates coincided with a significant high or low in 77 percent of cases and Venus dates in 83 percent of cases.
Editorial reading: those case counts justify a watch date only. They do not authorize a trade and they do not describe how price travels between events.
Map phase with a seasonal-sketch
The charting procedure borrowed from seasonal-cycle work placed a mark at each conjunction, looked for possible inversions one-half and one-third of the way between marks, and sketched the implied cycle.
That overlay is a seasonal-sketch. It marks event dates, mid-interval inversion candidates, and a dotted phase path between them. An inversion-marker is a candidate high or low placed one-half or one-third of the way between successive cycle event dates.
Editorial reading: this layer maps phase and mid-interval inversions. It does not issue a timed signal.
Score aspects, then tally a direction
Pairwise geocentric alignments were scored as directional only after later price change exceeded a stated 70 percent case threshold. Weaker cases were treated as insignificant. An aspect-score is a signed weight assigned when two bodies form a listed geocentric angle inside a small tolerance.
Once alignments had scores, a recurring tally on a daily, weekly, monthly, seasonal, or lunar schedule produced a majority-based directional expectation.
One running aspect index scored angles of 0, 60, 90, 120, and 180 degrees within a three-degree window, then added each day's total to a cumulative series. That cumulative aspect series sometimes moved with price and sometimes against it, including an opposite interval from July through October 1990 and a same-direction interval from July through September 1991, while its turns still showed some correspondence with market turns.
Editorial reading: a majority tally can shape a directional expectation. It still does not time the signal. The archive already showed that the cumulative series can travel with price or against it.
S&P 500 versus the Williams aspect-score index, 1990–1992
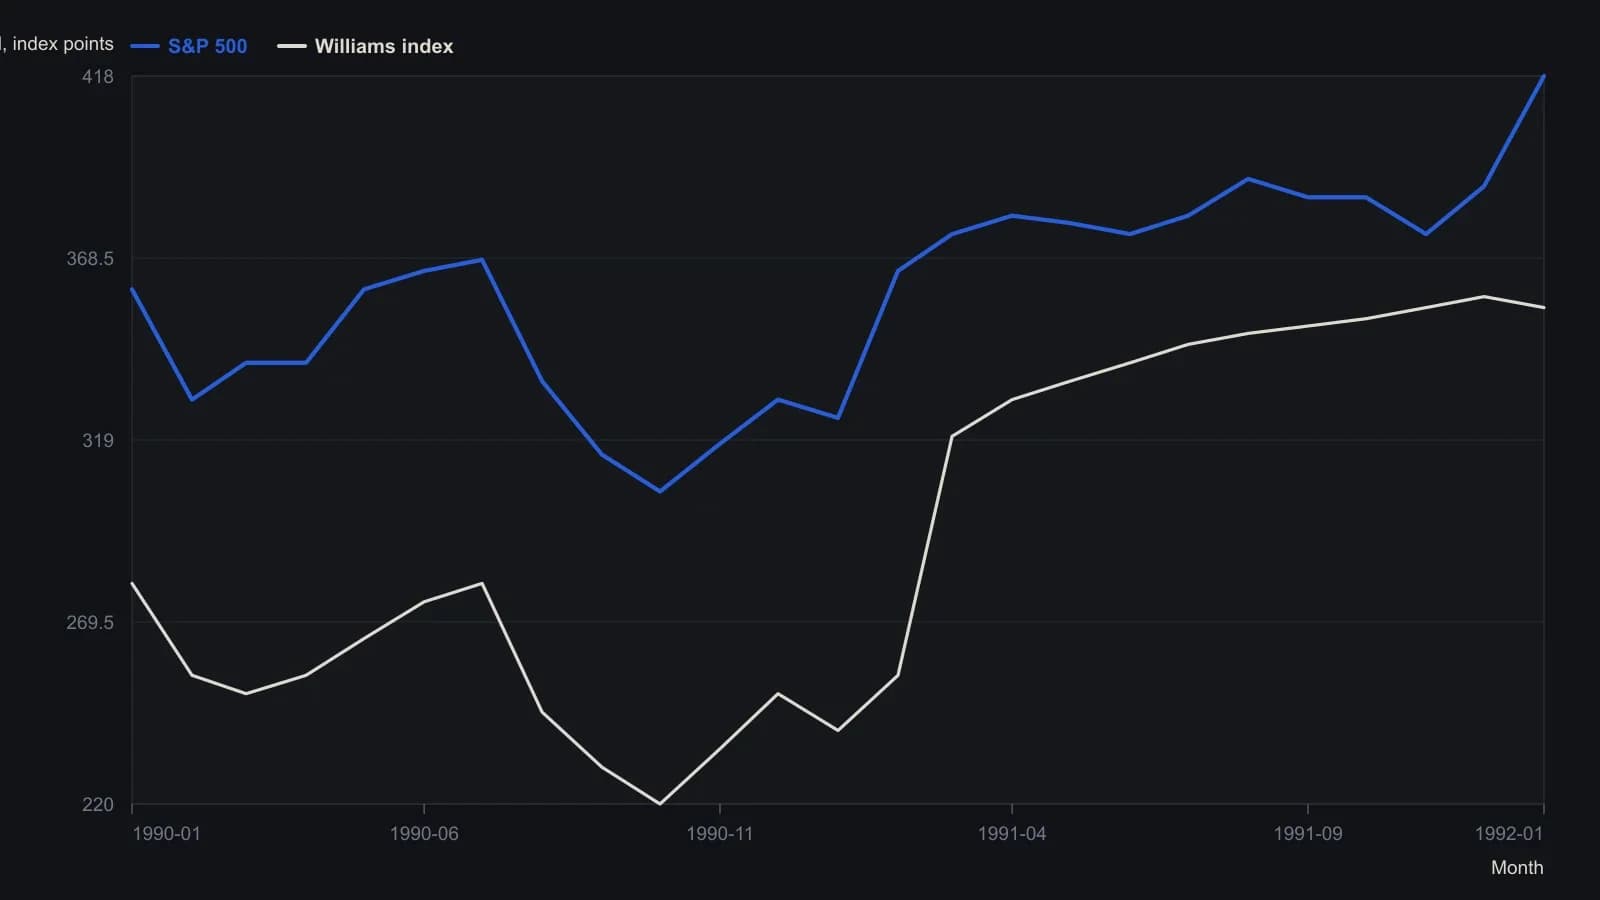
Williams index is a running sum of aspect scores (0° +10 except Saturn/Mars and listed pairs at −10; 60° +4; 90° −4; 120° +6; 180° −8) for aspects within three degrees. Digitized from the raster; points are approximate.
Time only inside the window
A stochastic-oscillator is a short-horizon oscillator, here a five-day calculation on intraday bars, used only to time action inside a nominated cycle window.
On 21 August 1991 Mercury and Venus both stood between Earth and the Sun; 10-centimeter solar flux rose sharply and the geomagnetic field rose then fell in that window. A five-day stochastic oscillator on 15-minute bars issued a sell on 14 August 1991, a buy on 21 August 1991, and a sell on 23 August 1991 around that double-conjunction window.
Editorial reading of that episode: the paired planetary-eclipse booked the watch dates, and only the stochastic-oscillator issued the timed signals. A seasonal-sketch, when used, would map phase and inversion-markers rather than replace that oscillator.