2006issue C021-6
Stacking one-session calendar filters on index regimes
A 1985-2004 cash-index case study isolates five calendar windows, drops January and August first-session longs, and stacks the rest on 708 of 5048 sessions so abstention and a continuous-hold baseline stay in view.
- The first-session-of-month rule is a same-day long from the open to the close, with January and August treated as abstention months after negative point totals and hit rates below one half.
- The remaining landmarks are a ninth-of-month short on the calendar date when it trades, an expiry-week long on the Monday before the third Friday, a last-November short, and a two-session Christmas long.
- The five windows are described as non-overlapping in direction, occupy 708 of 5048 sessions when stacked, and were applied to a futures proxy because the cash index is not itself a tradeable vehicle.
- A continuous-hold baseline of 1035 index points, about 0.2 points per session, can outpace the intermittent windows in years when the index advances without pause.
The study window
The archive records cash-index sessions from 1 January 1985 through 31 December 2004. Weekends and holidays are excluded, leaving 5048 sessions. A continuous-hold baseline on that path is stated as 1035 index points, or about 0.2 points per session.
The first-session hypothesis
The first-session-of-month hypothesis is a same-day long: enter at the open and exit at the close of that session. January and August first-session longs show negative point totals and hit rates below one half, so those two months are treated as abstention months rather than signal months.
Four more calendar landmarks
The ninth-of-month window is a calendar date, not a session count, and is specified as a same-day short only when that date is a trading session. The expiry-week window is the Monday before the third Friday, specified as a same-day long. The September 2001 occurrence is recorded as absent. Two further windows are specified: a same-day short on the last November session, and a two-session long into the Christmas holiday with exit on the following close.
A stacked yearly procedure
The five windows are described as non-overlapping in direction, so they can be stacked as one yearly procedure without a long and a short on the same day. Stacked, the windows occupy 708 of the 5048 sessions. They were applied to a futures proxy because the cash index is not itself a tradeable vehicle.
Yearly e-mini profit from the stacked calendar windows
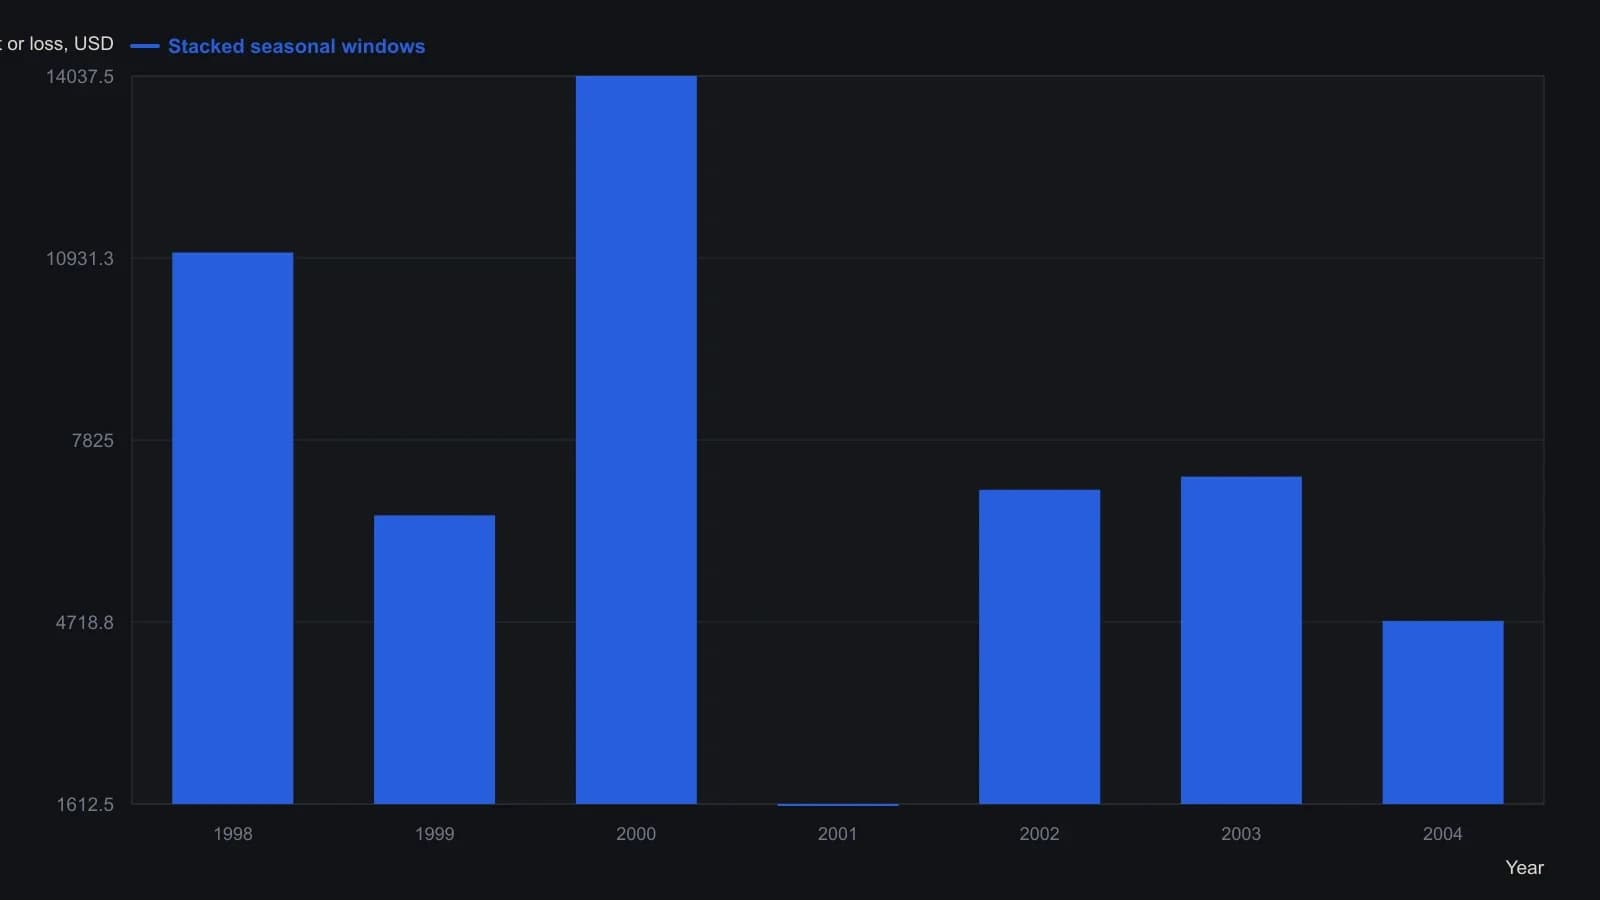
A $25 round-turn commission is already deducted and slippage is omitted. The companion equity-curve figure is labeled 20 November 1997 through 31 December 2004; this yearly table begins with calendar 1998, so the 1997 stub is left out.
When a continuous hold outpaces the windows
In years when the index advances without pause, a continuous hold can outpace these intermittent calendar windows. Seasonal analysis is a comparison of those calendar windows with a multi-year index path and time-in-market so a single day sits in a diversified or regime-aware context.
Three ways to read the same landmarks
Seasonal trading is a same-session long or short keyed to a calendar or expiry landmark, with entry, exit, and month-level abstention treated as one testable procedure. A seasonal chart pattern is a repeatable calendar-day condition on an open-to-close index path that can be framed as a falsifiable long or short hypothesis. The first-session, ninth-of-month, expiry-week, and last-November rules are open-to-close conditions of that kind. The Christmas window is specified as two sessions rather than one.
All readings on this track · 16 readings
- 1989Weekday price paths are regime-dependent
- 1990The January barometer as a rest-of-year scoring problem
- 1990Calendar windows as testable index-futures procedures
- 1991Testing the July-August summer rally as an occurrence count
- 1996Nested calendar clocks in long-bond futures
- 2006Stacking one-session calendar filters on index regimes
- 2008The January effect as a short window versus the month
- 2012A seasonal window still needs regime and chart confirmation
- 2013Calendar seasonality as a regime filter, not a standalone signal
- 2016A monthly seasonal heatmap as a three-gate regime filter
- 2016Payroll windows and settlement regimes
- 2017Memorial Day seasonal windows across equity, rates, and euro
- 2018Month-turn window, posture, and an open menu
- 2019Monthly FX regimes as three-state stances
- 2019Seasonal windows inside renewable cost regimes
- 2020When a breakdown fails by one box, treat it as a regime filter