2019issue C1244-47
Seasonal windows inside renewable cost regimes
One energy-transition cohort is used to keep a multi-year cost-curve regime separate from weeks-to-months seasonal windows. Each window is then bound to a calendar entry-exit pair and a chart condition so the theme can be tested as a procedure.
- The archive first set a regime-context from cost-curve-divergence: manufactured-energy unit costs were shown falling while an OPEC crude series and resource-extraction burdens were shown rising.
- Seasonal-windows were assigned name by name rather than as one sector season, then written as calendar-procedures with explicit sample-length limits.
- A seasonal-chart-pattern is the OHLC expression of those windows, used so a calendar tendency can be accepted or rejected as a visible setup.
- Editorial reading: a cohort-screen keeps the theme from collapsing into a buy-the-sector story by requiring earnings direction and price structure to sit on the same side of the regime shift.
A cost-curve regime before any calendar rule
The write-up assigned 11.5 trillion of new-energy generation spending between 2018 and 2050, of which 8.4 trillion was directed to wind and solar. Solar-module cost per watt was stated as falling from 101 dollars in 1975 to 0.36 dollars in 2018, with 0.18 dollars per watt projected by 2023. An OPEC crude series was shown rising from 1.21 dollars a barrel in 1970 to 109.45 dollars in 2012.
A schematic contrasted rising resource-extraction and cleanup costs with exponentially falling technology costs over time, framing a rotation from legacy resource industries toward manufactured energy names. That contrast is the cost-curve-divergence in the archive record.
Editorial reading: regime-context is this slower backdrop of falling manufactured-energy costs and rising extraction and cleanup burdens. It explains why a cohort exists before any date-based rule is tested.
Employment figures in the same backdrop
Global renewable-energy employment was given as more than 11 million in 2018, up from 10.3 million in 2017, with solar photovoltaic the largest block at 3.6 million jobs. A 2016 to 2026 occupational outlook in the write-up forecasted 105 percent growth for solar-panel installation and 96 percent for wind-turbine technicians.
Editorial reading: those labor figures sit inside the same regime-context. They do not, by themselves, specify a seasonal-window or a calendar-procedure.
Seasonal windows by name
Enphase Energy was assigned four seasonal-strength stretches: February to March, mid-June into July, early August into late September, and mid-October through November. Canadian Solar was shown with seasonal strength from March into July and from mid-August through year-end. NextEra Energy was given late January into June and mid-October through year-end windows. First Solar was assigned strength from late January through July and from mid-August into the third week of December. SolarWindow was presented as a pre-revenue speculative name with typical strength from mid-April through early December.
Each stretch is a seasonal-window: a recurring calendar period that can be marked independently of a single chart bar. The archive did not collapse the cohort into one shared season.
Calendar procedures and sample length
Those windows were then written as calendar-procedures, meaning a complete buy-date and sell-date pair treated as one entry, exit, and abstention system rather than as isolated tips. Enphase Energy carried a November 19 to March 19 pair flagged as resting on only six years of data, too short for long-horizon conclusions. Canadian Solar was tested as a November 19 to February 17 pair over 11 years. NextEra Energy was tested as February 15 to June 26 over 20 years. First Solar was tested as a November 22 to April 18 pair over 12 years.
The archive record states those holding periods and sample lengths. It does not, in the facts retained here, state a performance result.
NextEra Energy seasonal return through the calendar year
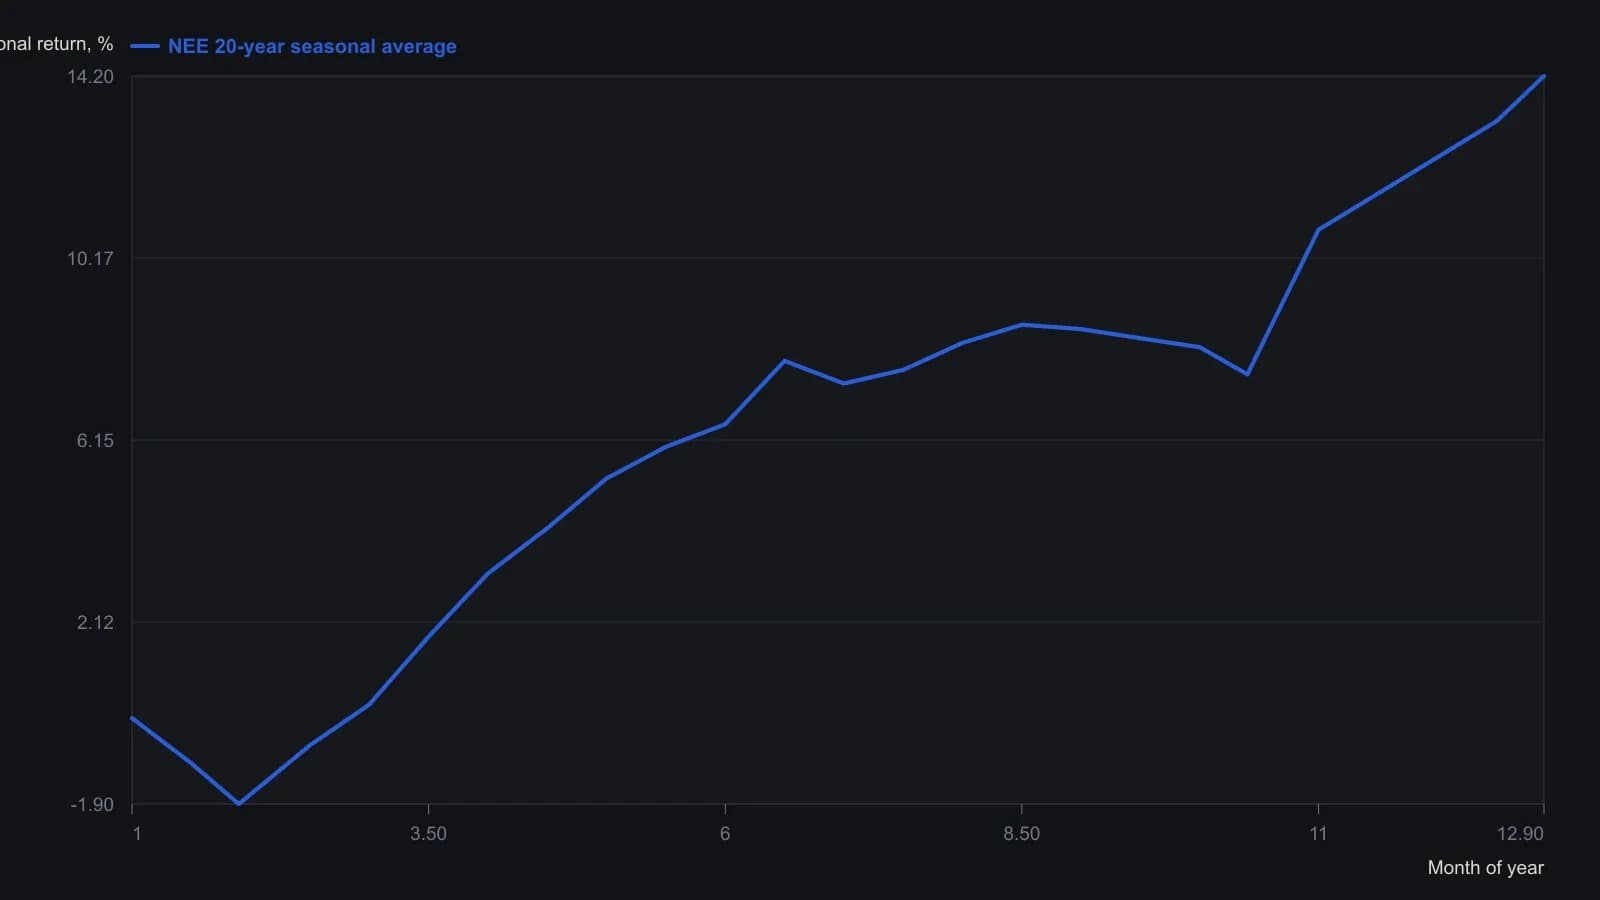
Composite covers the 20-year window ending 31 December 2018. Green trend marks on the source plot were window annotations and were not treated as a second series.
A chart condition that can be falsified
A seasonal-chart-pattern is the OHLC expression of a seasonal-window, such as a channel, a low-to-rally structure, or a repeated stretch of strength. Editorial reading: binding the window, the calendar-procedure, and that chart condition turns the energy-transition theme into a procedure that can be accepted or rejected, rather than a standing sector story.
Editorial reading: a cohort-screen keeps only names whose earnings direction and price structure sit on the same side of the regime shift. SolarWindow was already tagged as pre-revenue and speculative, which is a reminder that not every name in the theme belongs on that list.
All readings on this track · 16 readings
- 1989Weekday price paths are regime-dependent
- 1990The January barometer as a rest-of-year scoring problem
- 1990Calendar windows as testable index-futures procedures
- 1991Testing the July-August summer rally as an occurrence count
- 1996Nested calendar clocks in long-bond futures
- 2006Stacking one-session calendar filters on index regimes
- 2008The January effect as a short window versus the month
- 2012A seasonal window still needs regime and chart confirmation
- 2013Calendar seasonality as a regime filter, not a standalone signal
- 2016A monthly seasonal heatmap as a three-gate regime filter
- 2016Payroll windows and settlement regimes
- 2017Memorial Day seasonal windows across equity, rates, and euro
- 2018Month-turn window, posture, and an open menu
- 2019Monthly FX regimes as three-state stances
- 2019Seasonal windows inside renewable cost regimes
- 2020When a breakdown fails by one box, treat it as a regime filter