2017issue C0640-41
Memorial Day seasonal windows across equity, rates, and euro
A 2017 summer case study held Memorial Day fixed as a holiday-anchor and compared post-holiday windows in a large-cap equity ETF, an inverse long-duration Treasury ETF, and a euro-currency ETF. Each window was ranked by asset class, then a 30-day at-the-money tenor-matched-option was considered only after a forward price pattern was identified.
- Memorial Day was held fixed as a holiday-anchor so equity, inverse long-bond, and euro windows could be compared on one clock.
- The equity window was the 21 sessions after Memorial Day and was reviewed with more than 300 tests over a 10-year lookback, not as an open-ended summer advance.
- The inverse-bond window used an eight-year sample and treated 2013 as a rising-yield-exception, while the euro fund was treated as a risk-off-euro-proxy that can sit in an equity account and be traded with options.
- After a forward price pattern was identified, a 30-day at-the-money tenor-matched-option was compared across the three funds, with the equity contract the most expensive and the inverse-bond contract the least expensive.
One holiday clock for three funds
A 2017 summer case study used Memorial Day as a shared start date for post-holiday windows in a large-cap equity ETF, an inverse long-duration Treasury ETF, and a euro-currency ETF. Memorial Day functioned as a holiday-anchor: a fixed calendar date used to start every compared window so asset-class differences are not confused with different clocks.
The archive workflow was a seasonal-trading procedure. It bound each calendar window, market-state filters, and execution constraints into testable entry, exit, and abstention rules, rather than treating summer folklore as an open-ended forecast.
How the three windows were cut
The equity window was defined as the 21 sessions after Memorial Day rather than an open-ended summer advance. The equity review compiled more than 300 tests over a 10-year lookback on that post-Memorial-Day window.
The inverse long-bond ETF was used because it moves opposite 20-year Treasury prices and because listed options trade on it. That window used an eight-year sample and treated 2013 as a rising-yield-exception: a rates-regime year in which an inverse long-bond seasonal window is expected to break because Treasury prices are under pressure.
The euro-currency ETF was treated as a risk-off-euro-proxy, a euro-linked fund treated as a bid that can appear when equity risk appetite fades. It can sit in an equity account and be traded with options. The currency window was defined as the 30 days after Memorial Day.
From a summer pattern to a 30-day option
Summer was described as a low-volatility stretch that typically rises into autumn. That regime note was used to justify buying a 30-day at-the-money option after a forward price pattern is identified. The pattern step is a seasonal-chart-pattern: a repeatable price-structure condition, read on a stated chart scale, that can be written as a falsifiable trade hypothesis.
The overlay is an option-income-strategy: a rules-based option overlay whose tenor, strike, cost cap, and abstention conditions are specified with the seasonal window so the overlay can be tested as one system. The listed contract was a tenor-matched-option, an at-the-money option whose expiration is aligned to the seasonal holding period rather than to an open-ended forecast.
A 30-day at-the-money option comparison ranked the equity contract as the most expensive, the inverse-bond contract as the least expensive, and the euro contract between them.
FXE percent change in the 30 days after Memorial Day
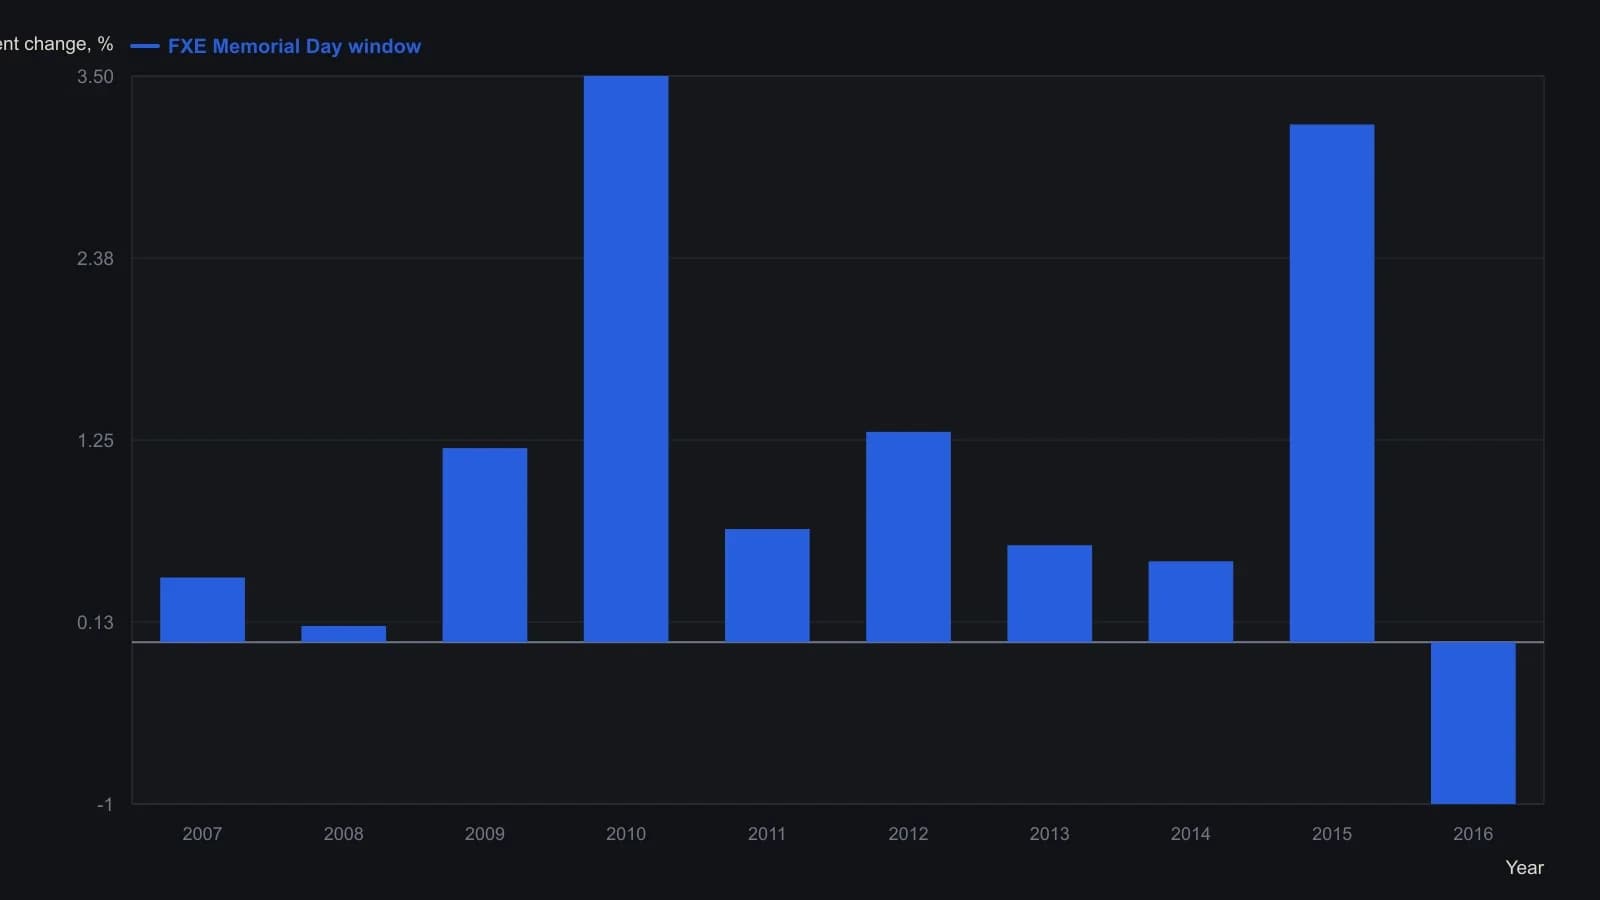
Scanner row for 0 days before and 25 days after Memorial Day is highlighted as a Buy at 1.00 percent average with 90 percent accuracy; the article describes the pattern as a 30-day window. Bar heights are approximate from the raster. 2008 is near flat and may be slightly positive or slightly negative within reading error.
All readings on this track · 16 readings
- 1989Weekday price paths are regime-dependent
- 1990The January barometer as a rest-of-year scoring problem
- 1990Calendar windows as testable index-futures procedures
- 1991Testing the July-August summer rally as an occurrence count
- 1996Nested calendar clocks in long-bond futures
- 2006Stacking one-session calendar filters on index regimes
- 2008The January effect as a short window versus the month
- 2012A seasonal window still needs regime and chart confirmation
- 2013Calendar seasonality as a regime filter, not a standalone signal
- 2016A monthly seasonal heatmap as a three-gate regime filter
- 2016Payroll windows and settlement regimes
- 2017Memorial Day seasonal windows across equity, rates, and euro
- 2018Month-turn window, posture, and an open menu
- 2019Monthly FX regimes as three-state stances
- 2019Seasonal windows inside renewable cost regimes
- 2020When a breakdown fails by one box, treat it as a regime filter