2008issue C051-3
The January effect as a short window versus the month
The January effect names a late-December to early-January firming window, not the whole month. An archive evaluation locked that January window on two small-cap benchmarks, then asked whether a window-versus-month check still agreed after the idea was widely known.
- The January effect, also called the year-end effect, is a historical tendency for prices to firm from the last December session through the first week of January, and it is treated as most relevant to small-capitalization stocks.
- The usual mechanism is a tax-loss reset: holders sell on the final session of the year and repurchase after the tax calendar resets.
- An evaluation locked the same January window on two small-cap benchmarks, then used a window-versus-month check to see whether the full January close still followed that short span.
- Later in the sample the month more often failed to match the window, and the archive leaves open whether a later down-window pattern persists.
What the January effect names
The January effect is a calendar hypothesis that prices, especially among smaller companies, tend to firm from the last December session through the first week of January, usually treated as ending on the fifth January session. The same span is also known by the older label year-end effect.
Discussion of the idea clusters in the last week of the old year and the first week of the new year. The window is treated as most relevant to small-capitalization stocks. The claim is about that short January window, not about January as a whole.
The tax-loss reset
The usual mechanism offered for the window is tax-motivated selling on the final session of the year, then repurchase after the tax calendar resets. That tax-loss reset is why the last December session and the first sessions of January are treated as one object of study.
The repeatable calendar condition is the late-year reset itself. It is a year-end window first, and only afterward a question about how the rest of January finishes.
Two small-cap benchmarks, one window
One evaluation measured the Russell 2000 from the last December session through the fifth January session. That span is the January window used for the check.
The S&P 600 was used as a second small-cap benchmark to cross-check the same year-end window rather than relying on a single series. The design asks whether the calendar window appears outside one benchmark, not whether a single chart can carry the slogan.
When the January close disagreed
A window-versus-month check asks whether the short window and the full January close move in the same direction. For the Russell 2000, the January close differed in direction from the January window in several years of the sample. Those mismatches were uncommon early and more frequent later.
For the S&P 600, the January close failed to follow the window in several listed years, including cases in which the window and the month moved in opposite directions. The second series did not simply repeat the first.
Small-cap January window versus the full month, 1988–2008
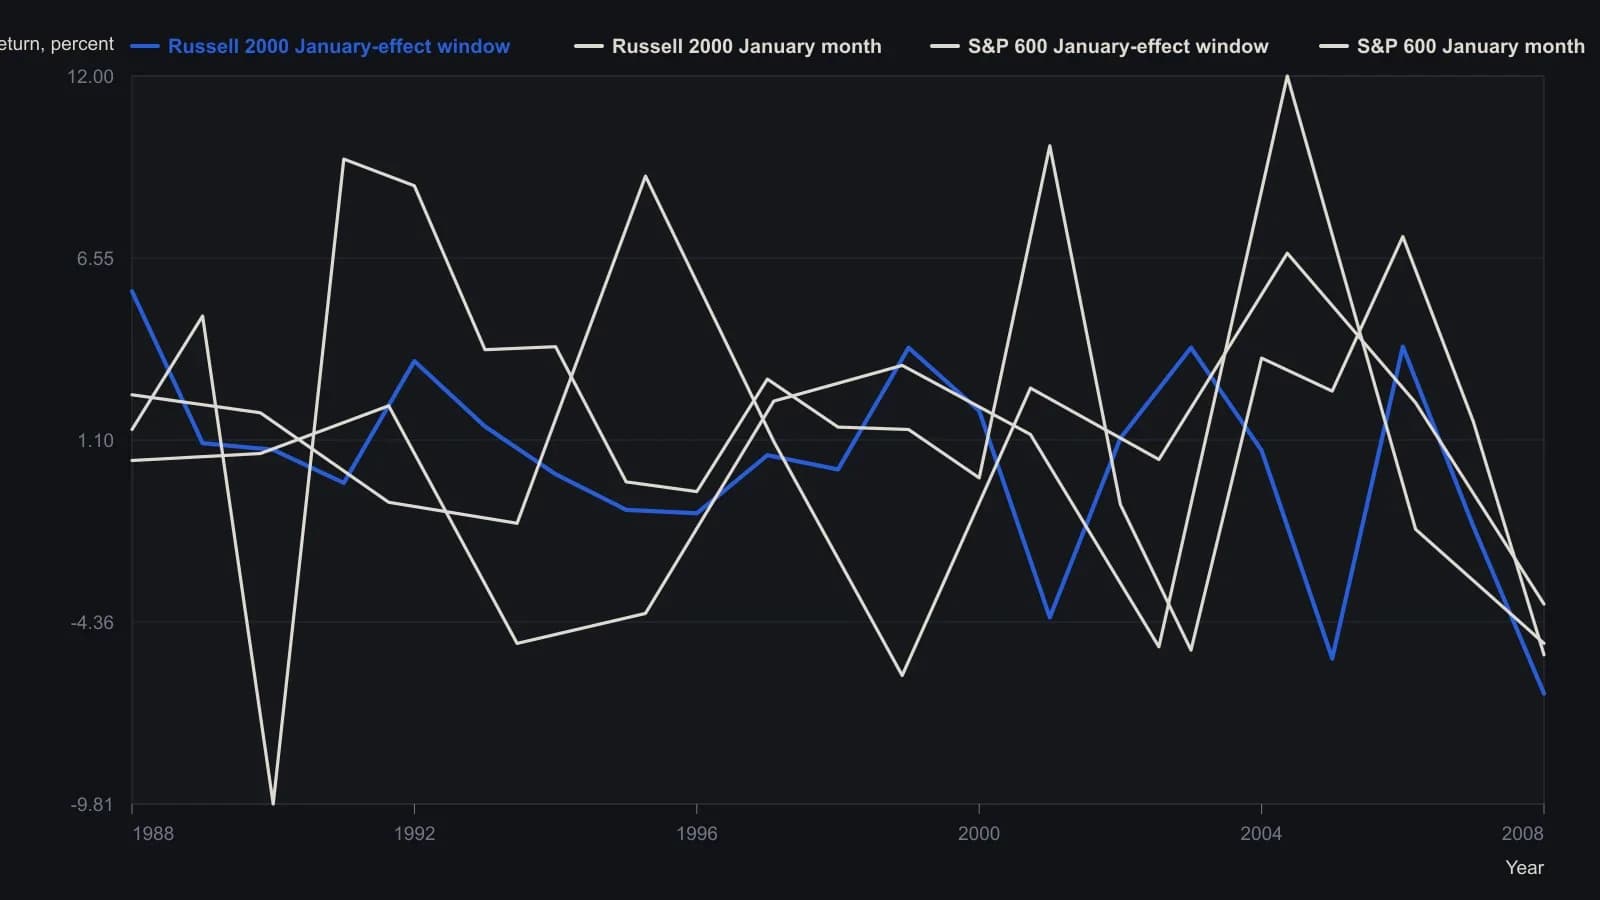
Devcic’s window is the last December session through about January 5. The printed year grids give unsigned magnitudes; signs are those implied by the article’s year comments and by the eight Russell / five S&P 600 years when the month finished opposite the window.
What the archive leaves open
The archive records a view that wider awareness has weakened the effect. It also notes that both small-cap series were lower in most of the last years of the sample.
Even while questioning whether small-caps still rise inside the window, the archive still treats that short span as a possible hint about how January may finish. Persistence of the later down-window pattern is left as an open question.
All readings on this track · 16 readings
- 1989Weekday price paths are regime-dependent
- 1990The January barometer as a rest-of-year scoring problem
- 1990Calendar windows as testable index-futures procedures
- 1991Testing the July-August summer rally as an occurrence count
- 1996Nested calendar clocks in long-bond futures
- 2006Stacking one-session calendar filters on index regimes
- 2008The January effect as a short window versus the month
- 2012A seasonal window still needs regime and chart confirmation
- 2013Calendar seasonality as a regime filter, not a standalone signal
- 2016A monthly seasonal heatmap as a three-gate regime filter
- 2016Payroll windows and settlement regimes
- 2017Memorial Day seasonal windows across equity, rates, and euro
- 2018Month-turn window, posture, and an open menu
- 2019Monthly FX regimes as three-state stances
- 2019Seasonal windows inside renewable cost regimes
- 2020When a breakdown fails by one box, treat it as a regime filter