2019issue C0314-19
Monthly FX regimes as three-state stances
This case froze each calendar month on three dollar pairs as bullish, bearish, or unused, then reused those labels as one long, short, hold, or sit-out procedure on a later window.
- The case asked whether a monthly time factor can stand in for waiting on a price-event trigger such as a breakout, oscillator extreme, or completed chart pattern.
- Seasonality-analysis used the in-sample window only to label each calendar month bullish, bearish, or unused from average monthly returns.
- Seasonal-trading applied those locked labels in the out-of-sample window, with each trendless month left unused and same-label stretches kept open as a held-through reversal.
- A seasonal-chart-pattern such as a month that historically leaned one way stayed a hypothesis, not a proof drawn after the later chart was seen.
What the case asked
The case asked whether a monthly time factor can stand in for waiting on a price-event trigger such as a breakout, oscillator extreme, or completed chart pattern.
The work used monthly bars on three liquid dollar pairs: EUR/USD, GBP/USD, and USD/CAD.
Labels from the earlier window
Seasonality-analysis compared the same calendar month across many years to decide whether that month usually behaved as a bullish, bearish, or unused regime.
Month labels were assigned from 1998-2013 average monthly returns, with a positive average treated as bullish and a mainly negative average treated as bearish.
Months whose average historical return was near zero were treated as a trendless month and were left out of the later-window trades.
That earlier stretch is the in-sample window. It was used only to assign each calendar month a bullish, bearish, or unused label.
One procedure on later data
The 2014-2017 stretch is the out-of-sample window. It reused those fixed labels and did not invent new ones.
Seasonal-trading is a complete procedure that turns a locked calendar-month label into an entry, hold, reverse, or sit-out decision and can be checked on a later window. The later window went long in previously bullish months and short in previously bearish months.
Each simulated month trade entered at the first trading day's open and exited at the last trading day's close of that same month.
When consecutive months shared the same bullish or bearish label, the position was held through until a month of the opposite label appeared. That held-through reversal kept one position open across the matching stretch.
Month stances by pair
For EUR/USD, April, June, July, September, and December were labeled bullish; January, February, May, August, October, and November were labeled bearish; and March was left unused as trendless.
For GBP/USD, April, June, July, September, and December were labeled bullish; January, February, March, May, August, and November were labeled bearish; and October was left unused.
For USD/CAD, January, June, July, August, October, and November were labeled bullish and February, March, April, May, September, and December were labeled bearish. The later window listed 24 trades rather than 32.
A chart condition, not a proof
A seasonal-chart-pattern is a repeatable time-and-price condition, such as a month that historically leaned one way, treated as a hypothesis rather than as proof after the chart is drawn.
Editorial note: freezing that condition as a regime label, then applying it unchanged, is what keeps the later window a check rather than a redraw of the months.
In-sample average return by calendar month
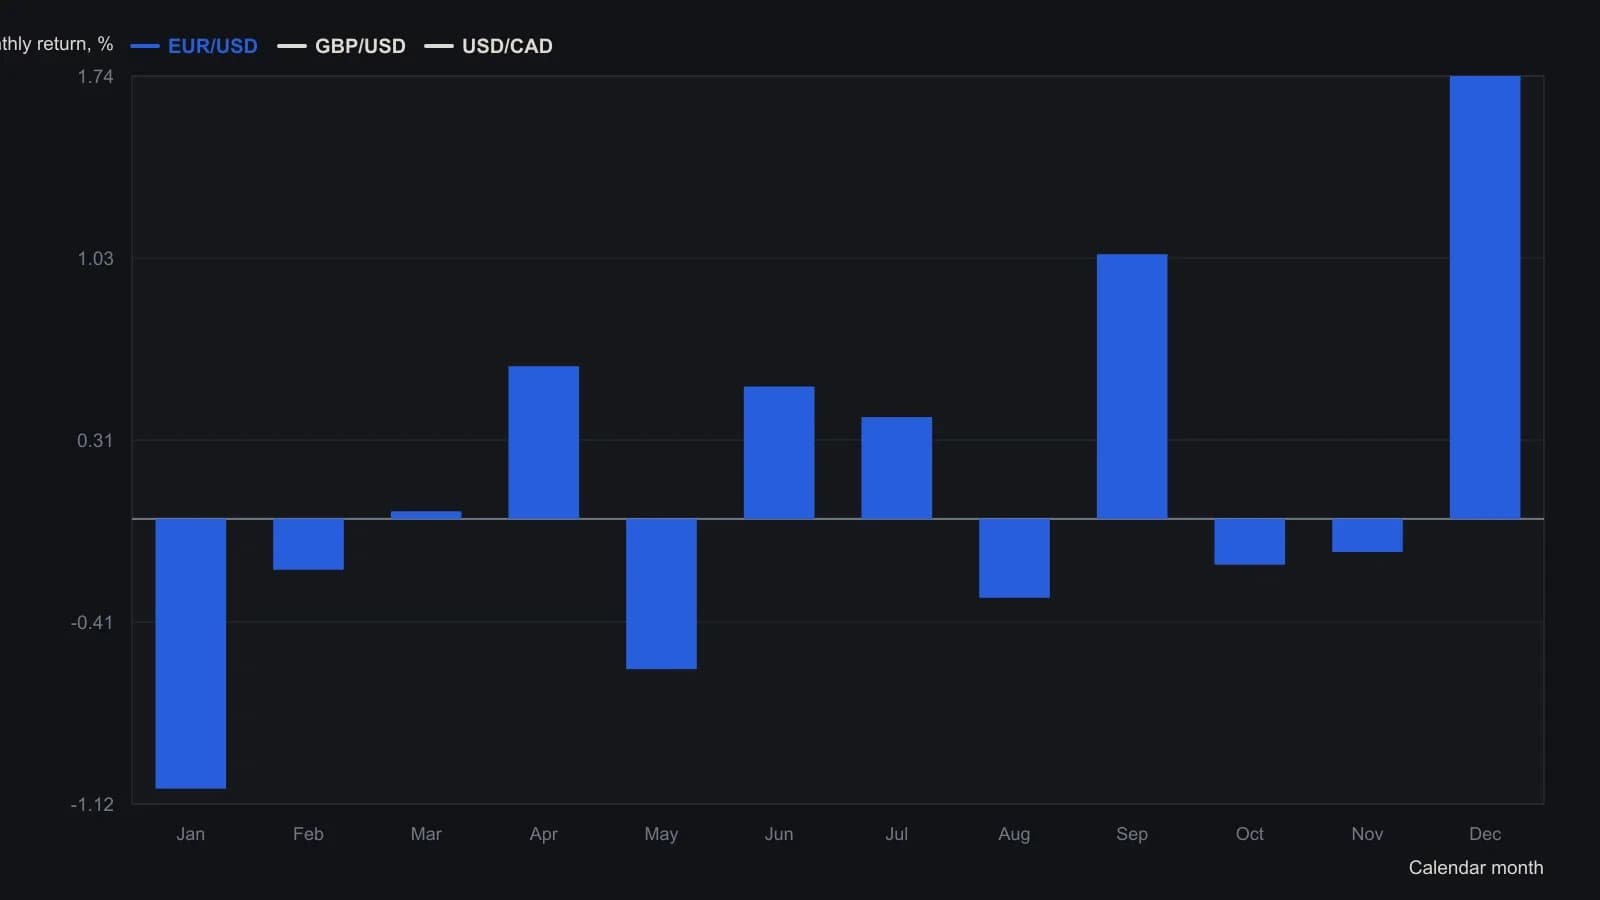
In-sample window is 1998–2013. EUR/USD March (0.03%) and GBP/USD October (0.01%) were treated as trendless and left out of the 2014–2017 procedure.
All readings on this track · 16 readings
- 1989Weekday price paths are regime-dependent
- 1990The January barometer as a rest-of-year scoring problem
- 1990Calendar windows as testable index-futures procedures
- 1991Testing the July-August summer rally as an occurrence count
- 1996Nested calendar clocks in long-bond futures
- 2006Stacking one-session calendar filters on index regimes
- 2008The January effect as a short window versus the month
- 2012A seasonal window still needs regime and chart confirmation
- 2013Calendar seasonality as a regime filter, not a standalone signal
- 2016A monthly seasonal heatmap as a three-gate regime filter
- 2016Payroll windows and settlement regimes
- 2017Memorial Day seasonal windows across equity, rates, and euro
- 2018Month-turn window, posture, and an open menu
- 2019Monthly FX regimes as three-state stances
- 2019Seasonal windows inside renewable cost regimes
- 2020When a breakdown fails by one box, treat it as a regime filter