1991issue C111-5
Evaluating successive policy hikes as equity regime warnings
A three-increase-signal tags a tightening regime only after three successive rises in the discount rate, the reserve requirement, or the margin requirement. Historical evaluation treated that label as an early multi-month warning and graded lead-time by whether a nearby reserve-rule change sat in the same window.
- A tightening regime is tagged only after three successive increases in the discount rate, the reserve requirement, or the margin requirement, not after a single hike.
- Later equity paths were not uniformly downward. The construct was read over the next two years as an early multi-month warning, not as a short-horizon trade trigger.
- Median lead-time from the signal to the rally high before the largest later downturn was five months on the DJIA and three months on a broad stock-index proxy.
- Reserve-requirement increases or new reserve classifications around some signals were associated with shorter leads. The long-lead 1928 and 1989 cases did not have that overlap.
What the three-increase-signal tags
A market-regime-classification tag is applied only after three successive increases in any one of three official settings: the discount rate, the reserve requirement, or the margin requirement. The discount rate is the interest rate Federal Reserve banks charge member banks for direct loans. The reserve requirement is the share of deposits commercial banks must hold as cash reserves, historically classified by bank type and deposit interval. The margin requirement is the minimum percent of a stock's current price that must be posted when buying or shorting the stock.
The three-increase-signal is that regime marker. It does not fire on a first or second hike. Official settings change infrequently. Since 1914 the discount rate was adjusted less than twice a year on average, and the stock margin requirement had last been changed in January 1974.
The historical count and the misses
Through early 1989 the historical count was 13 signals: 11 from discount-rate sequences, one from reserve requirements dated 1 May 1937, and one from the margin requirement dated 21 January 1946. Near-repeat reserve signals after 1948 and 1973 were excluded from the sample.
The label did not sit in front of every large equity drop. Equity declines of more than 15 percent in 1923, 1962, and 1987 were not preceded by a three-increase-signal.
A multi-month warning, not a short-horizon trigger
Each signal's influence was evaluated mainly over the next two years. Later equity paths were not uniformly downward. Lag, depth, and length of subsequent declines varied widely from case to case.
Lead-time is the interval from the signal date to the rally high from which the largest later downturn begins, measured in months. The median lead-time was five months on the DJIA and three months on a broad stock-index proxy. Average post-signal paths showed the DJIA still advancing at six months and reaching a later low around 18 months, so the construct was treated as an early multi-month warning rather than a short-horizon trade trigger.
After the 1989 signal the DJIA did not suffer a serious decline until more than a year later. Like the 1928 signal, it remained above the signal-date close for at least two years while still declining between the sixth and eighteenth months.
DJIA percent change after a three-increase policy signal
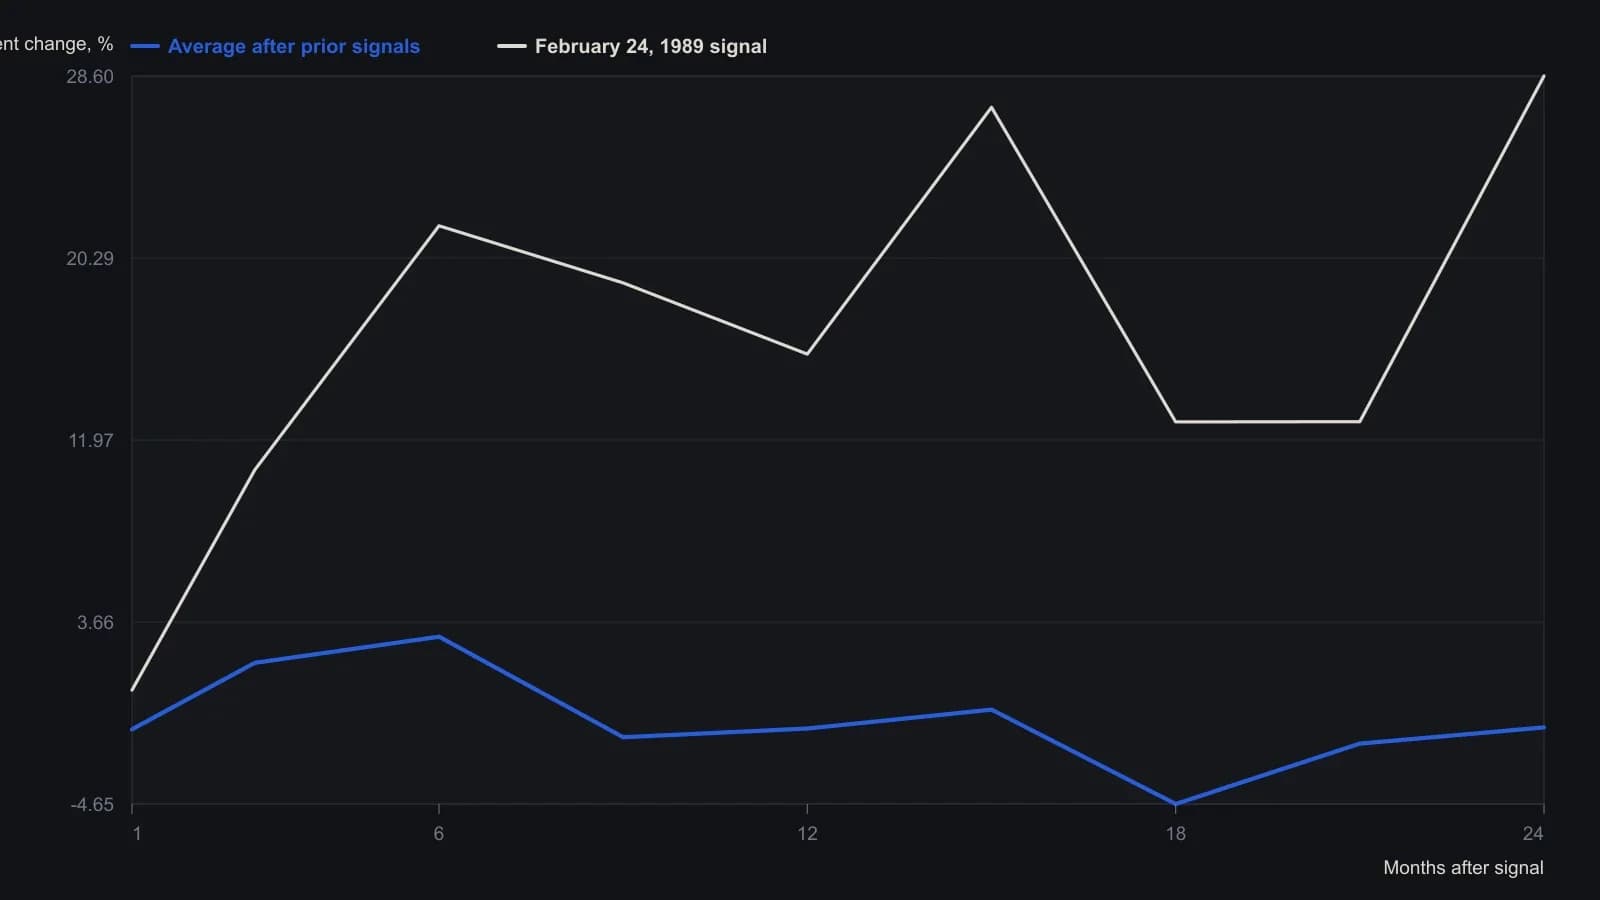
Each signal’s influence was scored over the following two years. Later reserve-requirement prints that arrived within a few months of an earlier signal were treated as repeats and left out of the average.
Grade the same label with nearby reserve events
A fundamental-overlay does not treat the three-increase-signal as a standalone price cue. It layers reserve-requirement levels, reserve-classification rewrites, and related statutory bank-reserve changes onto the same policy event. Event-driven-context then reads that policy-rate signal together with nearby regulatory or statutory reserve events that can shorten, lengthen, or duplicate the regime window.
Reserve-requirement increases or new reserve classifications clustered around the 1937, 1948, 1965, 1968, 1973, and 1980 signals and were associated with shorter leads. Five of 11 discount-rate signals had that overlap. The long-lead 1928 and 1989 cases did not.
Editorial reading
This paragraph is a TradersWeek editorial reading, not an archive claim. The third successive official-rate hike is useful as a multi-month tightening-regime label for an equity book only after it is graded by whether a nearby reserve-rule change sits in the same window. That overlay, not the hike count alone, is what historically compressed or stretched lead-time.
All readings on this track · 23 readings
- 1990The discount-rate path as an equity regime overlay
- 1991Evaluating successive policy hikes as equity regime warnings
- 2002Easing season meets commodity-bond reflation
- 2002Precious metals as portfolio insurance in uncertain regimes
- 2003Housing leverage after an equity crash
- 2003US rebound, capital-flow funding, and dollar translation
- 2003A three-path tape for recovery, inflation, or deflation
- 2006Disaster shocks, energy bottlenecks, and intermarket spillover
- 2008Speculative leaders and regime context for ten-bagger setups
- 2008A presidential transition as a dollar regime-timestamp
- 2009Check the regime before you hunt a setup
- 2009Withhold an equity regime label until credit-linked ratios agree
- 2010Energy futures, the dollar, inventory, and scenario risk
- 2011Official floors, sidelines, and scale-in after a telegraphed FX intervention
- 2014Scheduled prints as sector pair filters
- 2016Place a yuan devaluation inside peg, contract, and funding context
- 2017Quiet tape, seasonal soft edges, and event risks
- 2017A search-theme mood compass for regime-aware trade context
- 2018Bound headline trades with if-then paths
- 2019Election windows as testable regime filters
- 2020Climate capital rotation as a regime, then an event test
- 2020New listings as regime-aware portfolio events
- 2020One pre-trade checklist for event phase, pairs, and pattern outcomes