2009issue C071-61
Withhold an equity regime label until credit-linked ratios agree
A 2008-2009 case study used a treasury-equity ratio and a credit-equity fear ratio to place S&P 500 breaks in a wider backdrop. Editorial reading: do not apply market regime classification from one equity print until a credit-linked ratio and a dated stress event agree.
- Withhold a market-regime label from a single equity break until a credit-linked ratio and a dated stress event agree on the backdrop.
- The treasury-equity ratio can act as an intermarket-lead, marking bond-stock dislocations before they are obvious on the equity series.
- The credit-equity fear ratio compares stress in investment-grade credit protection with stress in equity implied volatility.
- In this case study, late-September and late-November ratio prints lined up with a later equity decline and a labeled bear-market rally, not with the first equity print alone.
One equity break is not a regime
During the 2008-2009 credit-stress window, the archive used two credit-linked ratios to place an equity move in market regime classification. The first is the treasury-equity ratio: a long Treasury yield divided by a broad equity index, used to flag bond-stock dislocations. The second is the credit-equity fear ratio: an investment-grade credit-protection index divided by equity implied volatility, used to compare stress across markets.
Editorial reading: Event-driven context supplies the dated stress window. Fundamental overlay supplies the credit comparison. Market regime classification is the label that should wait for both.
Backtested net profit by security, 2003–2008
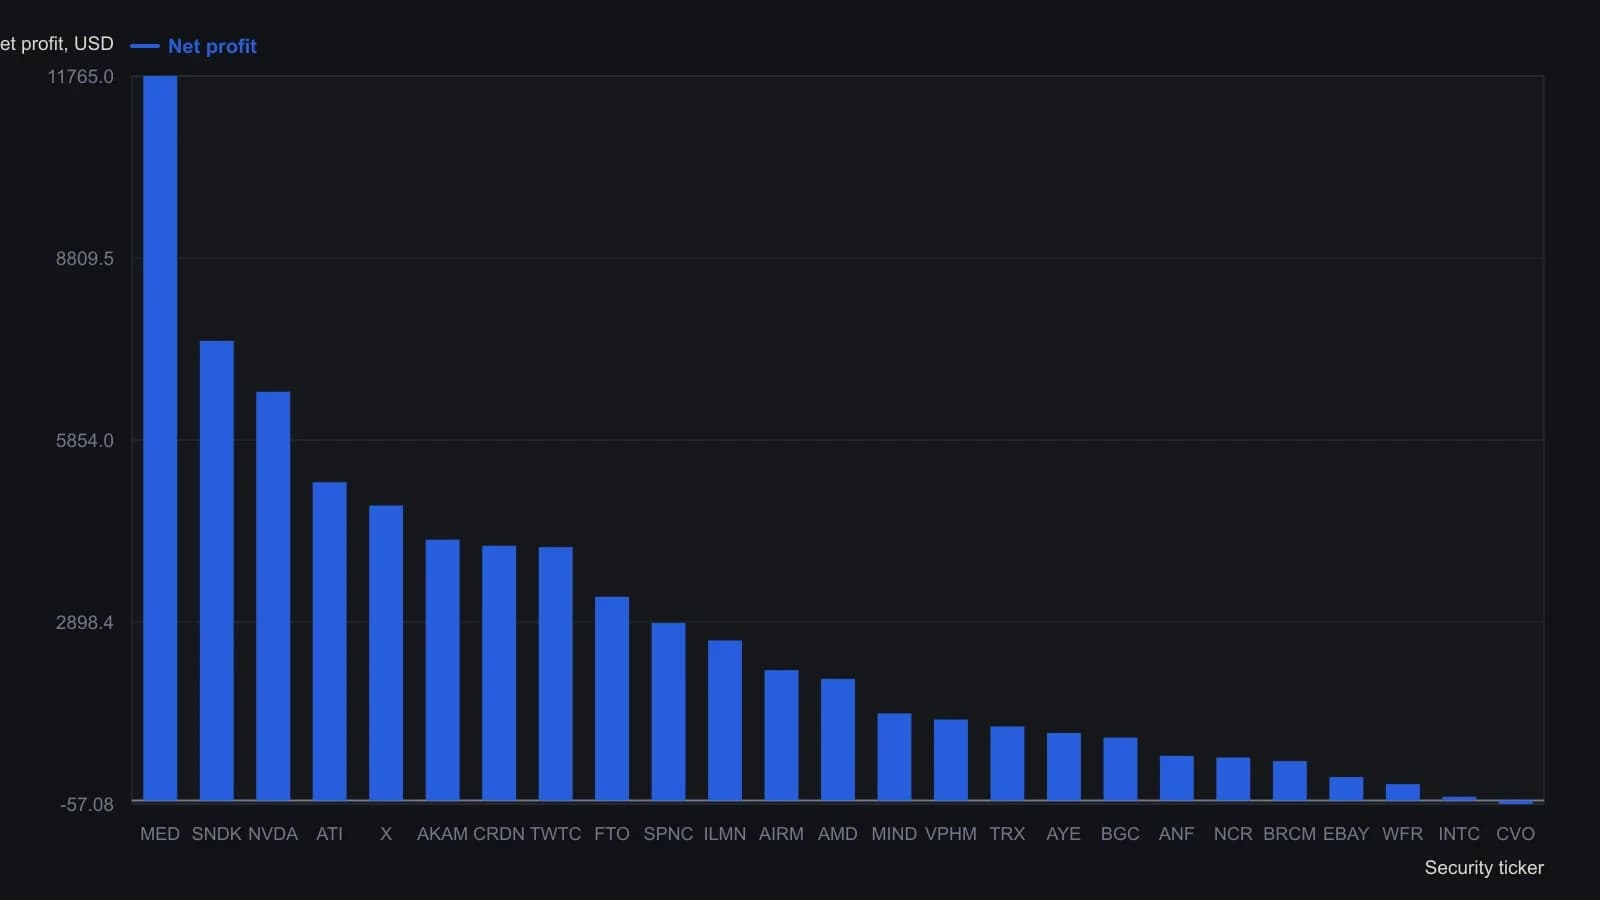
Each row uses 16 January 2003–10 November 2008 except Cenveo, which starts 17 May 2004. Percent gain in the table equals net profit divided by a $1,000 starting stake.
The treasury-equity ratio as an intermarket-lead
The archive described a ratio of the 10-year US Treasury yield to the S&P 500 as a way to mark money-flow dislocations between government bonds and equities before those dislocations were obvious on the equity series itself. That pattern is an intermarket-lead: a ratio break that appears before the matching move on the equity index itself.
On 22 September 2008 the yield-to-index ratio gapped higher from a six-week base and crossed its 50-day moving average. The S&P 500 was not described as breaking down until 29 September 2008. After that late-September equity breakdown, the case study recorded the S&P 500 falling from 1200 to 741, a 38 percent decline, inside two months.
The same ratio built an October-December double top and dropped through its 50-day moving average on 24 November, one day after the index bottomed near 741 and then rose about 200 points, or about 27 percent. On 1 January 2009 the ratio broke upward from a short double bottom. On 6 January the index began another decline. At the archive's time of writing, the index stood at 676.53, about 27 percent below that January start.
The credit-equity fear ratio as a relative-fear gauge
An investment-grade credit-default-swap index divided by equity implied volatility was treated as a relative-fear gauge. A rising ratio was read as more stress in credit than in equities. A falling ratio was read as more stress in equities than in credit.
An uptrend channel in that credit-to-equity fear ratio broke down around 20 September 2008, after which the equity market was described as dropping 34 percent. A symmetrical triangle in the same ratio from October into mid-November resolved higher around 24 November, coinciding with an S&P 500 advance from about 750 to 931 that was labeled a 24 percent bear-market rally beginning 21 November.
When the two checks agree
Editorial reading: the late-September cluster is the clearer agreement. The treasury-equity ratio broke higher on 22 September 2008. The credit-equity fear ratio's uptrend channel broke down around 20 September 2008. The dated stress event is that same September window. The equity breakdown was described only on 29 September. That sequence is why a single equity print is a late label, not the start of market regime classification.
The late-November cluster is the other agreement. The treasury-equity ratio lost its 50-day moving average on 24 November, one day after the index bottomed near 741. The credit-equity fear ratio's triangle resolved higher around the same date, coinciding with the advance labeled a bear-market rally from 21 November. Editorial reading: those two ratio prints and the dated November event are the backdrop. The equity rally is the matching move, not a standalone regime change. A ratio can lead or only line up with the equity move. Neither print is a trade.
All readings on this track · 23 readings
- 1990The discount-rate path as an equity regime overlay
- 1991Evaluating successive policy hikes as equity regime warnings
- 2002Easing season meets commodity-bond reflation
- 2002Precious metals as portfolio insurance in uncertain regimes
- 2003Housing leverage after an equity crash
- 2003US rebound, capital-flow funding, and dollar translation
- 2003A three-path tape for recovery, inflation, or deflation
- 2006Disaster shocks, energy bottlenecks, and intermarket spillover
- 2008Speculative leaders and regime context for ten-bagger setups
- 2008A presidential transition as a dollar regime-timestamp
- 2009Check the regime before you hunt a setup
- 2009Withhold an equity regime label until credit-linked ratios agree
- 2010Energy futures, the dollar, inventory, and scenario risk
- 2011Official floors, sidelines, and scale-in after a telegraphed FX intervention
- 2014Scheduled prints as sector pair filters
- 2016Place a yuan devaluation inside peg, contract, and funding context
- 2017Quiet tape, seasonal soft edges, and event risks
- 2017A search-theme mood compass for regime-aware trade context
- 2018Bound headline trades with if-then paths
- 2019Election windows as testable regime filters
- 2020Climate capital rotation as a regime, then an event test
- 2020New listings as regime-aware portfolio events
- 2020One pre-trade checklist for event phase, pairs, and pattern outcomes