2013issue C016-7
The average directional index as a lookback cluster and a risk-reward bound
A rebuilt directional-movement worksheet was to be read by plotting the average directional index, the plus directional indicator, and the minus directional indicator as three separate lines. Lookbacks were restated in short clusters, and a later reply said there is not always a single optimal risk-reward ratio or exit strike rate.
- The rebuilt worksheet was to be read by plotting the average directional index, the plus directional indicator, and the minus directional indicator as three separate lines.
- The restated lookbacks for the average-directional-index cluster lines are 3, 4, and 5. Both directional-indicator lines use 5, 8, and 14, not a third setting of 13.
- The method was described for end-of-day charts, with intraday signals characterized as generally harder to handle, and a calculation sidebar was said not to implement the trend-start method.
- No archive item answered the profitability identity that pairs risk-reward ratio with strike rate, and the reply said there is not always a single optimal pair.
A written parameter set
A rebuilt directional-movement worksheet was to be read as three separate lines rather than as one unmarked default. TradersWeek editorial reading: treat that recipe as a written parameter set. Record the lookback cluster on each line before a signal is read, and record a risk-reward bound before entry, because neither the indicator settings nor a payoff ratio arrives as a single universal default.
How the rebuilt worksheet was read
The rebuilt worksheet was to be read by plotting the average directional index, the plus directional indicator, and the minus directional indicator as three separate lines. The average directional index is a smoothed comparison of net directional movement with total directional movement, shown here as one line in a small lookback cluster. The plus directional indicator is a lookback-smoothed measure of upward directional movement, plotted with its downward counterpart. The minus directional indicator is a lookback-smoothed measure of downward directional movement, plotted with its upward counterpart.
The method was described as applying to end-of-day charts, with intraday signals characterized as generally harder to handle.
Lookbacks restated as a parameter cluster
A parameter cluster is a short list of neighboring lookbacks drawn together so agreement among settings can be inspected. The restated lookbacks for the average-directional-index cluster lines are 3, 4, and 5. The restated lookbacks for both directional-indicator lines are 5, 8, and 14, not a third setting of 13.
ADX and directional-indicator lookback clusters
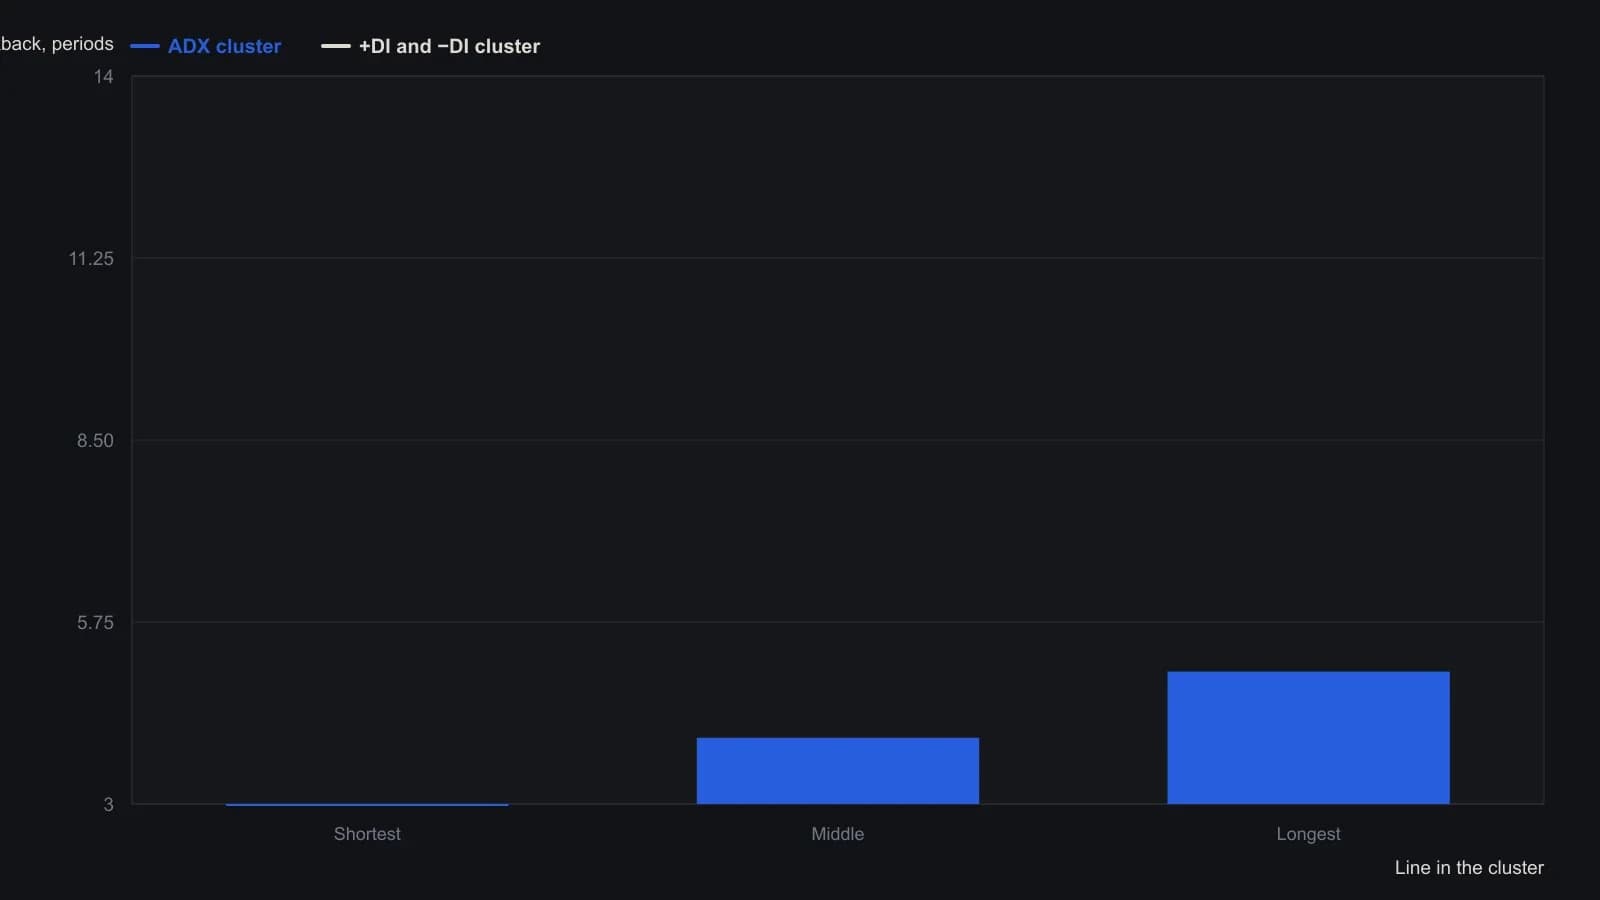
A reader had listed the directional-indicator lengths as 5, 8 and 13; Low corrected the longest of those lookbacks to 14. He also writes the three lines in separate end-of-day MetaStock windows and does not claim an intraday version.
Risk-reward ratio and strike rate
A reader asked what risk-reward ratio and strike rate are required for profitability when average winning-trade size is compared with average losing-trade size. A risk-reward ratio is a comparison of average or planned gain size with average or planned loss size, used to bound a trade before entry. Strike rate is the share of trades that must be winners for a stated risk-reward relationship to be profitable.
No archive item was identified that answered that profitability identity directly, though earlier money-management pieces were said to discuss how to calculate risk-reward ratios. The same reply stated there is not always a single optimal risk-reward ratio or a single exit strike rate that fits every case.
All readings on this track · 27 readings
- 1987Precommit the stop and require a surplus payoff
- 1987When open losses overwrite precommitted exit rules
- 1991Ranking month-end holds with risk-reward and stops
- 1994Evaluating percentage profit exits on trend-following averages
- 2001Construct reward to risk before entry
- 2003A pre-trade readiness checklist for entry, abstention, and risk
- 2003Evaluating out-of-the-money strikes with saddle premiums and implied volatility
- 2004A critique of one-procedure trading decisions
- 2004Mechanical stops leak intent and misprice losses
- 2004Implied-volatility premium on rate indexes
- 2006Keep the stop that authorized the entry
- 2006Bound the loss with a risk-to-reward filter before entry
- 2007Audit the operator before abandoning a system
- 2007Failed-break slingshot reversal rules
- 2007A system-management template that sets the stop and the required reward before entry
- 2007Construct a pre-trade style envelope for entries and skips
- 2008Systems that skip the three decision gates
- 2010Four-gate veto before trend entries
- 2012Construct a trading plan as one written procedure
- 2012Forex stops and reward targets by quote increment
- 2013The average directional index as a lookback cluster and a risk-reward bound
- 2014A three-step worksheet for VIX futures tick value and low-vol risk-reward
- 2014Binary option premia, fees, and pre-expiry risk-reward
- 2015Selling far out-of-the-money commodity option premium as a forgiving timing case
- 2016Prepaid option spreads that bound range-day risk and reward
- 2016Pre-trade risk-reward versus instinctive exits
- 2020Bounding a short-dated option spread with a stop, a gap remainder, and a credit exit