1991issue C031-5
After a Wyckoff bias, rank leftover cause and keep three-to-one stops
Once the first Wyckoff steps set a long or short bias and a candidate list, leftover cause from the current price ranks which names still qualify. Only those whose stop beyond last defined support still clears a three-to-one bound stay as opportunities.
- The first two Wyckoff steps set a long or short bias and a candidate list; later steps rank leftover cause and then acceptable risk.
- Remaining potential is the unused share of the point-and-figure objective measured from the current price, not from the original count level.
- Names that have already left their count levels can fail a remaining-potential floor such as 50 percent even if they ranked well earlier.
- A support-anchored stop must sit beyond defined support and keep leftover points to the objective at least three times the points to that stop.
Bias first, then leftover cause
The first two Wyckoff steps set a long or short bias and a candidate list. The next steps rank which of those names still qualify as opportunities.
The Wyckoff method is a stepwise screen that first sets directional bias and a candidate list, then ranks leftover cause and acceptable risk before later checks of readiness to move.
How a cause becomes an objective range
A point-and-figure cause is a horizontal cluster of postings at one level or across a narrow band during a trading range, measured by the number of chart divisions it occupies.
Point-and-figure is a price-scale chart of those postings. It measures a sideways horizontal cause in divisions and projects a matching vertical effect. The count is the number of divisions across that buildup, treated as a one-for-one estimate of later vertical movement.
The objective range is the price band formed by adding the count both to the measurement level and to the trading-range low.
A 1990 count from 52
In the 1990 example, a January-to-April range of about 51 to 55 was counted at 52, the last reaction low before the upside break. That cluster spanned 17 divisions and was recorded as a 17-point cause at that level.
The 17-point horizontal cause was projected as a 17-point vertical effect and added both to the 52 count level and to the range low. That produced an objective band of 68 to 69, or about 33 percent of the value at the count level.
Bristol-Myers 17-point cause at 52 and leftover room to 68–69
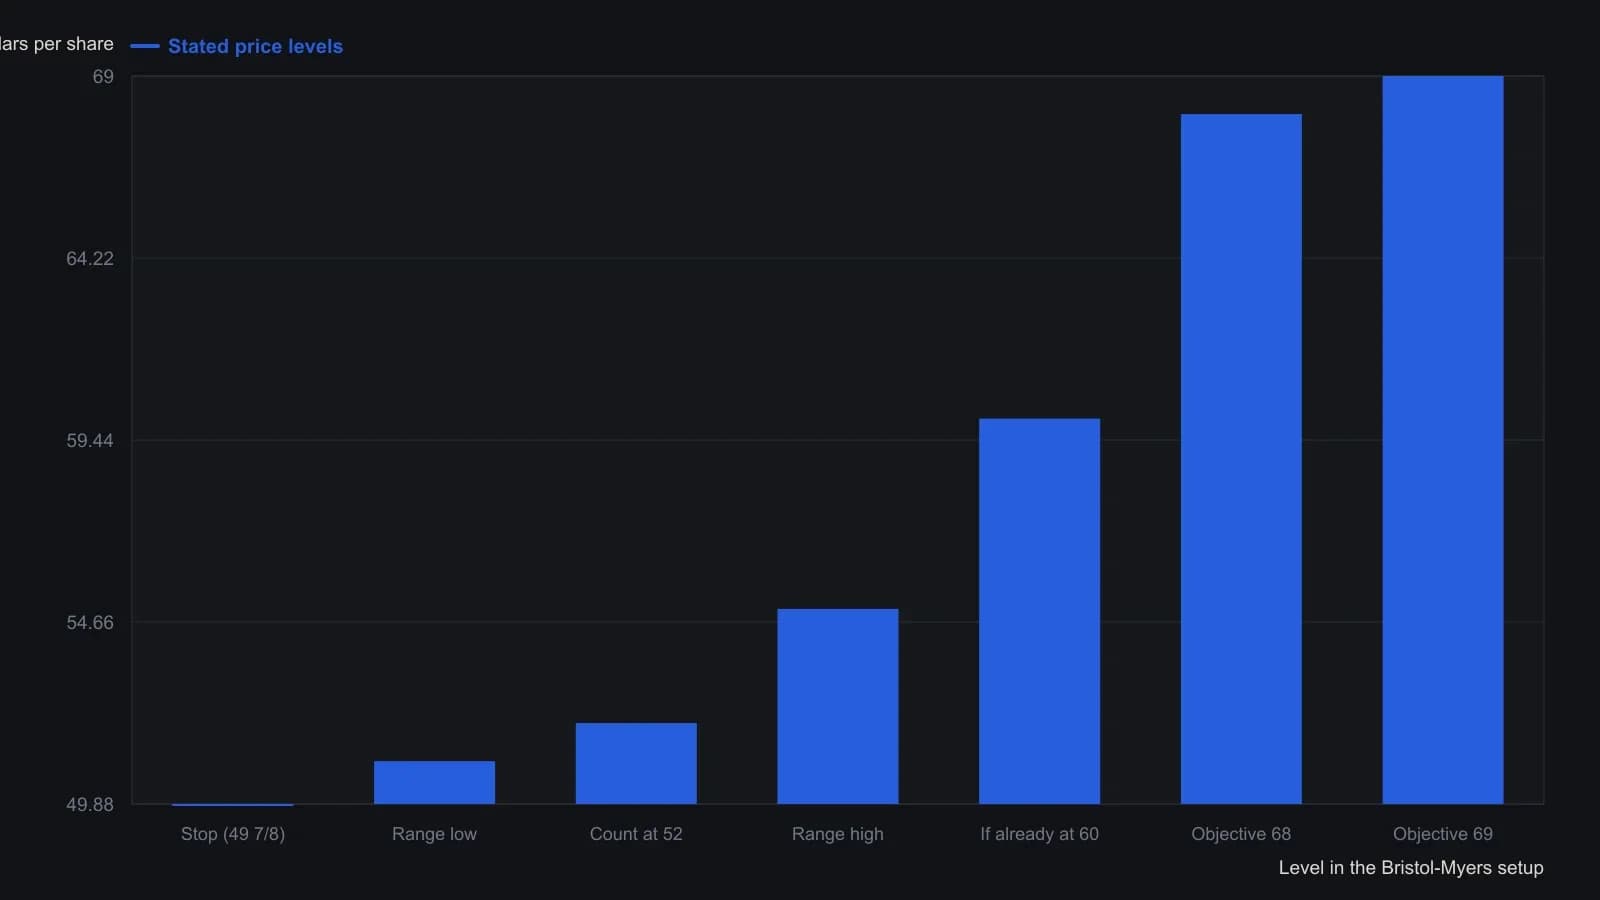
The 51–55 trading-range band is the article's own approximation. The count uses one-point boxes and is taken at 52 because that was the bottom of the last reaction before the upside breakout. Objective 68 is 51 plus 17; 69 is 52 plus 17.
Measure remaining potential from the current price
Remaining potential is the unused share of the objective measured from the current price, not from the original count level. Leftover move is the distance from the current price to the objective.
The same 52-level count implied about a 30 percent advance if price was still 52, but only 13 percent leftover if price had already reached 60.
Larger counts are treated as larger leftover potential. When many names survive the earlier steps, a floor such as 50 percent remaining potential is used to shorten the list.
The strongest or weakest names are least likely to still sit in a trading range and most likely to have left their count levels behind. They can fail the remaining-potential screen even if they ranked well on earlier steps.
Keep only stops that clear three to one
A stop is required to cap a loss or protect an open gain. It must sit beyond previously defined support, and it must keep anticipated points to the objective at least three times the points to that stop.
The risk-reward ratio taught here is a pre-entry filter that compares points to the leftover objective with points to a support-anchored stop. The floor is three to one. A support-anchored stop is an exit placed beyond a previously defined support level so that risk stays smaller than the leftover objective under that floor.
With 16 points of potential from 52 to 68, the three-to-one floor allowed as much as 5 1/4 points of risk. Because the range printed 51 and did not trade below 50 1/8, a stop as high as 49 7/8 against a 52 entry risked 2 1/8 points, or 16 to 2.1.
All readings on this track · 21 readings
- 1986Figure-chart construction, counts, and halfway tests
- 1986Constructing Wyckoff trendlines on vertical and figure charts
- 1987Stand down or rehearse on paper when a Wyckoff read fails
- 1987Wyckoff campaign phases as one enter, exit, or stay-out procedure
- 1990Two-bar narrow range as a countdown to the next open
- 1991Channel location as a remaining-room test
- 1991Swing relative strength versus an index proxy
- 1991After a Wyckoff bias, rank leftover cause and keep three-to-one stops
- 1991Timing individual issues to general-market turns
- 1991Constructing a halfway volume map for range resolution
- 1998Wyckoff action sequence as a classroom chart drill
- 1999Hand-plotted point-and-figure trendlines and Wyckoff counts
- 2000Constructing volume confirmation from recent activity
- 2007Diagnose the range on bars, then count it on point and figure
- 2011Wyckoff cause count and spring tests
- 2014Reading the 2008-14 DJIA as a Composite Operator campaign
- 2015Confirm a price-action pivot only after independent signals agree
- 2016A double top stays unfinished until candles show control
- 2016Wyckoff's early clerkship as a campaign-reading case study
- 2016Reading campaign phases as a live drill
- 2017Three clocks on the same crowd life cycle