2013issue C1118-27
The weekly 1-2-3 map as a permission layer
Editorial reading: a daily close through the eight-day average is only a live hypothesis if the weekly 1-2-3 map still allows a wave 1 or wave 3. In the archive case, later targets were then checked with a Fibonacci projection of the last impulse and the nearest median-line pitchfork rail.
- On the weekly map, a later wave 3.3 above the wave-3.2 high stays a live hypothesis only while corrective wave 2 holds above the start of wave 3.2.
- The daily checklist requires the expected zigzag to be counted as a wave-1-or-3 before a long or short is allowed.
- A wave-2 reaction is context or a limited fade, not a new impulse entry.
- Fibonacci projections, retracements, and pitchfork channels are targeting and invalidation tools used after the irsts-checklist, not in place of it.
The weekly map as a permission layer
TradersWeek editorial aim: teach swing traders to treat the weekly 1-2-3 map as a weekly-permission-layer. A daily close through the eight-day average is only a live hypothesis if the larger count still allows a wave-1-or-3.
On the weekly map, a later wave 3.3 above the wave-3.2 high stays a live hypothesis only while the current corrective wave 2 holds above the start of wave 3.2.
The daily wave-1-or-3 filter
The daily entry checklist requires the expected zigzag to be counted as a wave 1 or a wave 3 before a long or short is allowed. A wave-1-or-3 is the only zigzag treated as a valid continuation trade. A wave-2 reaction is context or a limited fade, not a new impulse entry.
The irsts-checklist is the eight-condition daily filter. It combines an eight-day exponential-average break, a turning-point candle, volatility-band proximity, and a wave-1 or wave-3 count.
The August and October daily checks
In the 26 August 2010 daily example, a close above the eight-day exponential average coincided with a morning-star low later confirmed by a bullish engulfing candle, and the last turn sat near the volatility-band low.
A later close below the eight-day exponential average on 5 October 2010 was checked against a 161.8 percent Fibonacci projection of the prior decline from wave 3 to wave 3.2, which landed at 15.53 and nearly matched the weekly 23.6 percent retracement.
A wave-2 reaction short was framed first by a common 50 percent retracement toward 14 and later by a 61.8 percent Fibonacci retracement near 13.55, with nearby moving-average support treated as a reason to take the reaction rather than press a new impulse short.
Waiting after the wave-3.1 high
After a presumed wave-3.1 high, the weekly 38.2 percent retracement near 22.06 had already been broken on the rally, so the case preferred waiting for a turn near 22 and targeting the next 50 percent weekly retracement at 27.31 instead of shorting the correction.
Once price turned up from the 22 area, a Fibonacci projection from the last wave-2 low through the prior wave-3.1 high produced a 161.8 percent extension at 28.16, used to raise the primary target after a gap toward the weekly 50 percent retracement.
That measured extension is the fibonacci-projection in this workflow: a completed swing is projected to estimate where a later wave may stall when it agrees with a higher-timeframe retracement.
Pitchfork rails and the later weekly veto
When price reached the long-term 50 percent upward retracement while also approaching the upper rail of an upward pitchfork and riding the upper volatility channel, the weekly map expected a reaction toward the 200-week average and the lower pitchfork rail, leaving room for a valid wave-2 correction.
A median-line-pitchfork is a three-point Andrews-style channel. Its upper and lower rails mark where an impulse is extended and where a later wave-2 reaction may be aimed.
A later weekly decline that undercut the previous wave-2 low was counted as a new downward wave 1, ending the prior upward-impulse hypothesis.
Fibonacci projections and retracements plus pitchfork channels are applied after the eight-condition entry as targeting and invalidation tools, not as substitutes for the wave-1-or-3 and candle-turn checklist.
Ciena weekly 1-2-3 map and the later veto
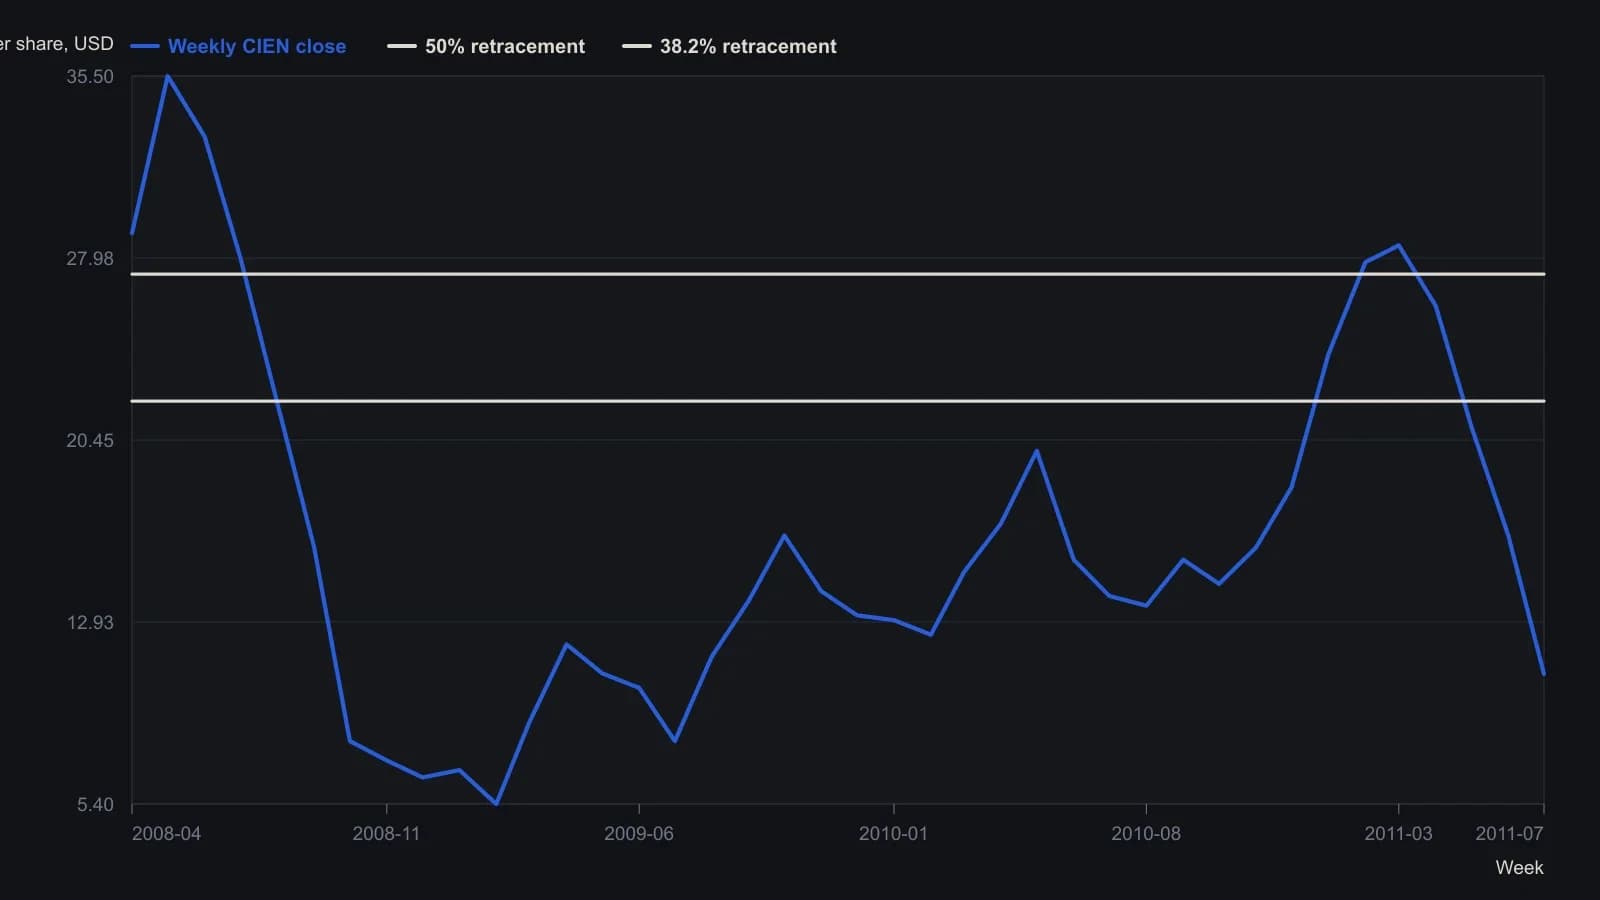
Weekly candles digitized from the NinjaTrader pane. Moving averages, the volatility band and the median-line pitchfork are visible on the source but are not rebuilt as series. Fibonacci percentages are the printed retracement of the 49.55-to-5.07 decline.
All readings on this track · 19 readings
- 1985Constructing median lines from graded pivots
- 1986Constructing median and action-reaction lines from pivots
- 1989Median line construction from three market turns
- 1990A failed median-line test marks the start of wave three
- 1995Constructing three-pivot median-line channels
- 1996Median-line pitchfork construction for trend and reversal tests
- 2000Nested median-line channels as falsifiable swing tests
- 2002Median-line versus speed-resistance on one trend
- 2003Independent witnesses: a median-line miss, a breadth average, and volume bands
- 2012Constructing oblique trendlines and median-line channels
- 2013Gold futures wave four, competing complexes, and written ratio tests
- 2013The weekly 1-2-3 map as a permission layer
- 2014Measured-move and daily pivot price-projection construction
- 2014Constructing median-line channels from a pivot
- 2016Median-line far parallel as a precommitted exit
- 2017How high is high: Elliott wave landmarks
- 2017A three-layer veto for a suspected third-wave high
- 2020Basic chart rules for Nasdaq trend reversals
- 2020Stacking wave counts, retracements, and median lines