2020issue C1014-19
Basic chart rules for Nasdaq trend reversals
A daily Nasdaq chart is treated as a classroom. Moving averages, a Median line channel, and a flag are stacked only after a measurable swing, then entry, stay-in, and exit are written as three separate if-then rules.
- Stack Moving average lines, a Median line channel, and a flag only after the daily Nasdaq example has already printed a measurable swing.
- A stated long-entry rule is a bounce from the channel floor that breaks a rising 20-day linear-weighted middle line, while the stay-in test is price remaining above a 55-day linear-weighted average of the weighted close.
- A copied first-decline height sets the down-leg target, and a higher low after that target plus a higher high versus the prior rebound peak is required before a long is opened with a stop at the current channel low.
- A rising flag, then later flags that hold a pitchfork median line, stay in force until a break of the middle-line averages ends the historical trades at about 1,200 points and about 750 points.
A daily index chart as a classroom
The archive walks a daily Nasdaq example as a worked sequence of chart conditions. Editorial reading: treat that chart as a classroom. Stack a few Moving average lines, a Median line channel, and a flag only after price has already printed a measurable swing. Then write the entry, the stay-in test, and the exit as three separate, falsifiable if-then rules.
On that daily example, two simple moving averages of 89 and 233 days are used as dynamic support and resistance. The volatility channel uses 30 daily bars, a 2.4 volatility range, and a 0.9 low-band adjust, with a 20-day simple moving average of the close as one middle line.
The stated long-entry and stay-in tests
A stated long-entry rule is a bounce from the channel floor that breaks a rising 20-day linear-weighted middle line. The trade is normally held while price stays above a 55-day linear-weighted average of the weighted close.
Editorial reading: those are not one rule. The bounce-and-break test says when a long is allowed. The 55-day line says only whether that long is still valid.
Measure first, then draw the Median line
A down-leg target is projected by copying the height of the first measured decline from a 50 percent rebound, so the third zigzag leg is expected to match the first. A pitchfork drawn through the first two swing points and a prior high is used to test whether price reaches the median line and whether the upper rail later breaks.
Editorial reading: the Median line is a path test after the swing is already measurable. It does not replace the copied height of the first decline.
Confirmation, flag, and assigned exit
A higher low after the projected target plus a higher high versus the prior rebound peak is treated as confirmation before a long is opened with a stop at the current channel low. After that long, a rising flag is described between prior-support resistance and the 89-day average. The later exit is a break of a wedge floor and all middle-line averages, assigned about 1,200 points.
Editorial reading: the Flag and pennant structure is added only after the confirmation swing. The flag is the stay-in picture. The exit is the break of the wedge floor and the middle lines.
Nasdaq-100 daily close through the May 2019 pullback
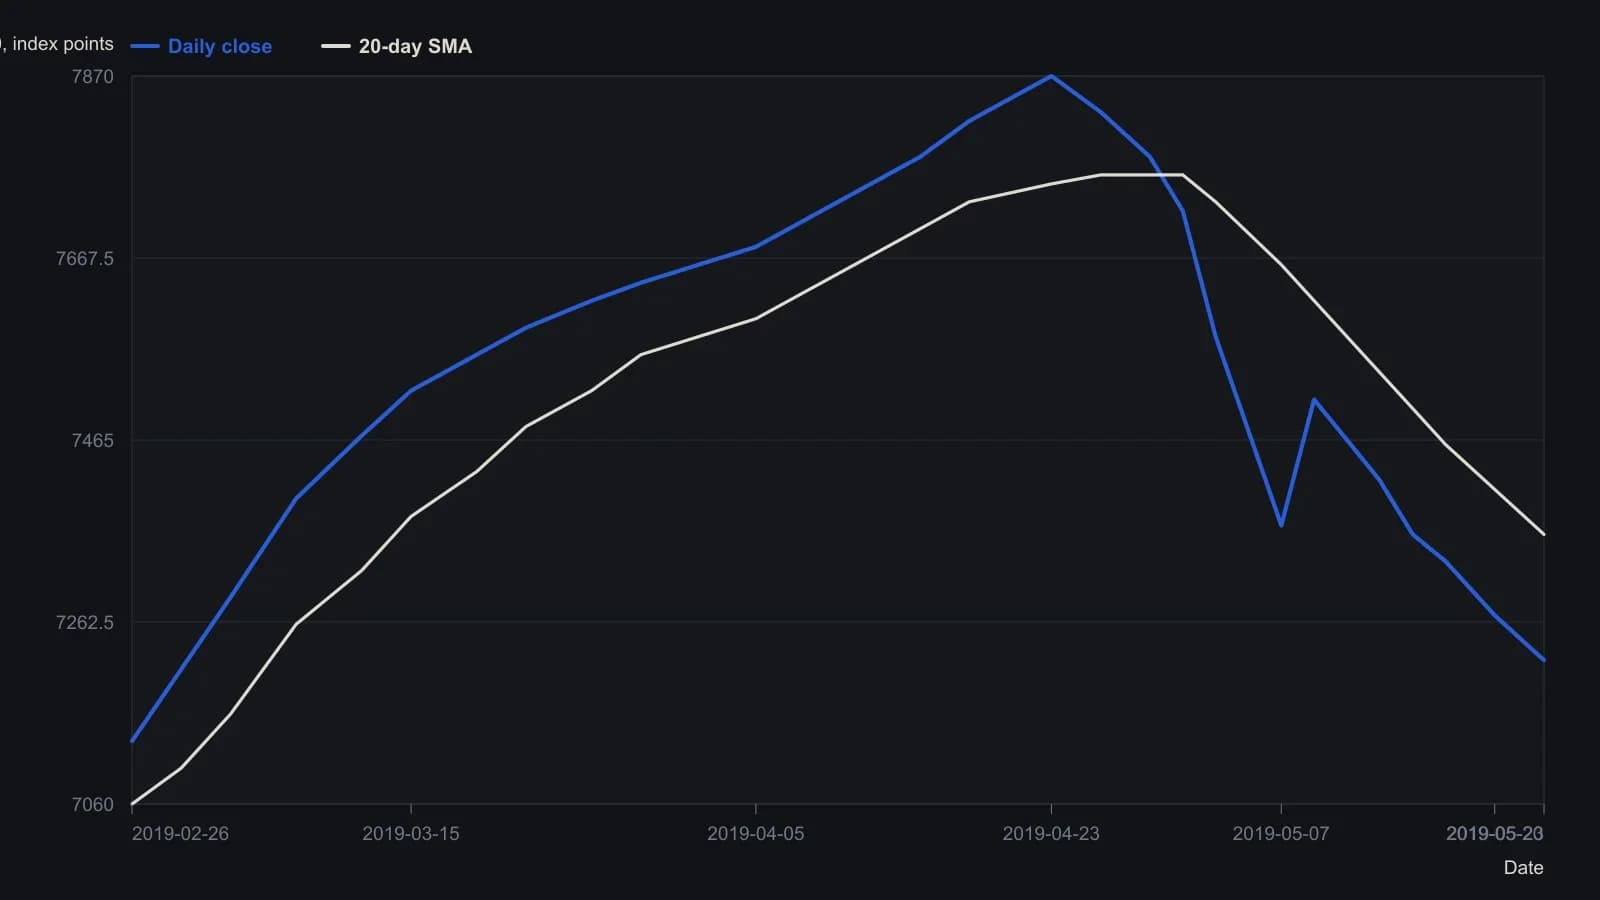
Readings are approximate to about 20 index points. The source also draws a pitchfork, a measured-move rectangle aimed at the May low, and slower 55-, 89-, and 233-day averages that are not digitized here.
A later long in the same classroom
A later long is managed inside a pitchfork from the long-term low, with successive flags holding the median line until a large down candle through the median line and the middle averages ends the trade at about 750 points.
Editorial reading: the same three tests appear again. Entry waits for structure. Stay-in is successive flags that hold the median line. Exit is a large down candle through the Median line and the middle Moving average lines.
Editorial if-then wording
If price bounces from the channel floor and breaks a rising 20-day linear-weighted middle line, and if a higher low after the projected target is joined by a higher high versus the prior rebound peak, then a long may be opened with a stop at the current channel low.
If price stays above the 55-day linear-weighted average of the weighted close, and if a rising flag holds between prior-support resistance and the 89-day average, or later flags hold the pitchfork median line, then the long remains open.
If price breaks a wedge floor and all middle-line averages, or if a large down candle crosses the median line and the middle averages, then the trade ends.
All readings on this track · 19 readings
- 1985Constructing median lines from graded pivots
- 1986Constructing median and action-reaction lines from pivots
- 1989Median line construction from three market turns
- 1990A failed median-line test marks the start of wave three
- 1995Constructing three-pivot median-line channels
- 1996Median-line pitchfork construction for trend and reversal tests
- 2000Nested median-line channels as falsifiable swing tests
- 2002Median-line versus speed-resistance on one trend
- 2003Independent witnesses: a median-line miss, a breadth average, and volume bands
- 2012Constructing oblique trendlines and median-line channels
- 2013Gold futures wave four, competing complexes, and written ratio tests
- 2013The weekly 1-2-3 map as a permission layer
- 2014Measured-move and daily pivot price-projection construction
- 2014Constructing median-line channels from a pivot
- 2016Median-line far parallel as a precommitted exit
- 2017How high is high: Elliott wave landmarks
- 2017A three-layer veto for a suspected third-wave high
- 2020Basic chart rules for Nasdaq trend reversals
- 2020Stacking wave counts, retracements, and median lines