1996issue C101-5
Median-line pitchfork construction for trend and reversal tests
A median line is drawn from one extreme pivot through the midpoint of the next corrective swing, then parallels through that swing’s high and low form a pitchfork channel. The frame defines trend and turns later reach, failure-to-reach, and redraws after a close beyond the lines into tests rather than a finished signal.
- Construct the pitchfork from three consecutive pivots of similar magnitude: draw the median line from the first extreme through the midpoint of the next corrective swing, then add a median-line-parallel through that swing’s high and low.
- Use the median line first to define trend. Price is described as typically advancing toward that line, and in a strong market it may reach the far parallel.
- Treat a new pivot that forms before price attains the median line as a failure-to-reach warning that the next swing may travel farther in the opposite direction.
- After a close beyond a median line or parallel, redraw on the latest three pivots and read the next reach or fail test against larger-scale channels. A pivot sitting near a major parallel is not a complete signal on its own.
A median line is a line drawn from an initial pivot through the midpoint of the next corrective swing. It is used to define trend direction and a target path for subsequent price action. Lines drawn parallel to that median line through the high and low of the corrective swing are the median-line-parallel references. Together they form the pitchfork channel used as support and resistance references.
How the pitchfork is constructed
A median line is constructed from one extreme pivot by drawing through the midpoint of the next corrective swing. Parallels are then added through that swing’s high and low to form the pitchfork channel.
The three construction points are consecutive turning points of similar magnitude. A major-pivot is a larger-magnitude turning point separated from neighboring extremes by two or more smaller-magnitude turns.
Defining trend with the median line
The median line is used first to define trend. Price is described as typically advancing toward that line. In a strong market, price may reach the far parallel.
Failure-to-reach as a warning
If a new pivot forms before price reaches the median line, that event is a failure-to-reach. The next pivot is then expected to travel farther in the opposite direction.
Redrawing after a close beyond the frame
After a close beyond a median line or a parallel, the pitchfork is redrawn on the latest three pivots. The next reach or fail test is then used to classify whether a major-pivot is being tested or the market is weakening.
Reading more than one magnitude
The same construction is applied at more than one pivot magnitude at once. A failure at a redrawn median line can then be read against the larger-scale channel rather than in isolation.
What is not a complete signal
A pivot merely sitting near a major parallel is not treated as a complete signal. The construction is meant to be combined with the rest of the reach, fail, and multi-scale tests before a hypothesis is acted on.
September 1996 S&P 500 futures inside the Andrews pitchfork
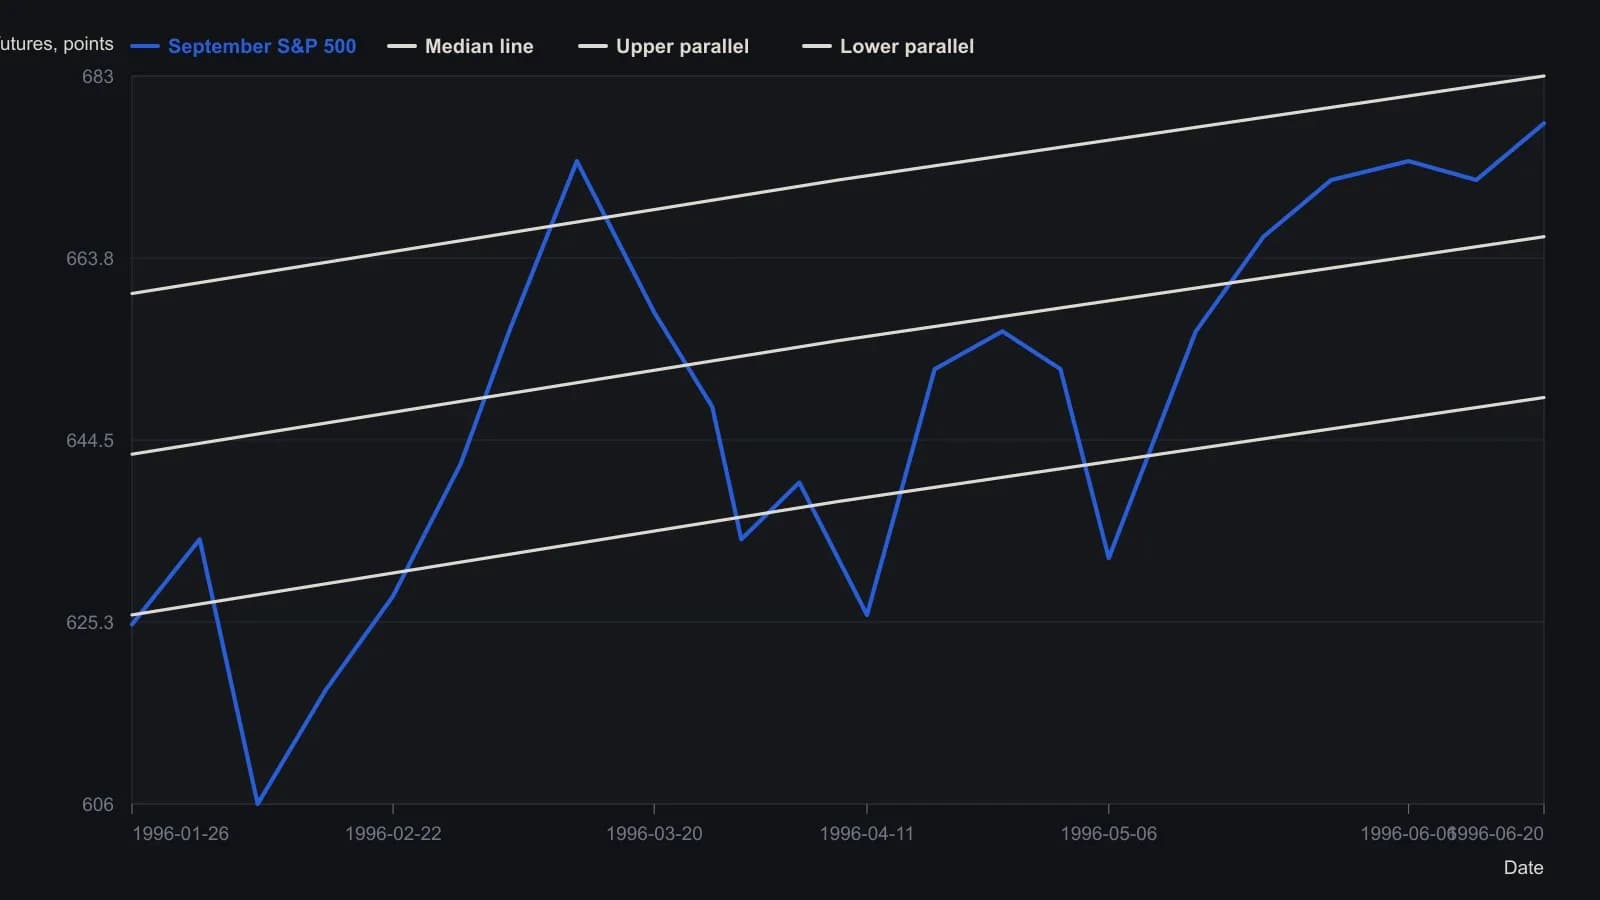
Source pivots are turns with at least two sessions between extremes; major M pivots have two or more smaller turns between them. The three blue lines are the median line and its parallels as drawn on the figure, not a recomputed pitchfork.
All readings on this track · 19 readings
- 1985Constructing median lines from graded pivots
- 1986Constructing median and action-reaction lines from pivots
- 1989Median line construction from three market turns
- 1990A failed median-line test marks the start of wave three
- 1995Constructing three-pivot median-line channels
- 1996Median-line pitchfork construction for trend and reversal tests
- 2000Nested median-line channels as falsifiable swing tests
- 2002Median-line versus speed-resistance on one trend
- 2003Independent witnesses: a median-line miss, a breadth average, and volume bands
- 2012Constructing oblique trendlines and median-line channels
- 2013Gold futures wave four, competing complexes, and written ratio tests
- 2013The weekly 1-2-3 map as a permission layer
- 2014Measured-move and daily pivot price-projection construction
- 2014Constructing median-line channels from a pivot
- 2016Median-line far parallel as a precommitted exit
- 2017How high is high: Elliott wave landmarks
- 2017A three-layer veto for a suspected third-wave high
- 2020Basic chart rules for Nasdaq trend reversals
- 2020Stacking wave counts, retracements, and median lines