2002issue C101-4
Median-line versus speed-resistance on one trend
After a trend is already underway, a three-pivot median-line channel and a fan of speed-resistance lines can map the same support-resistance problem in different ways. A 2001 daily case shows how pivot choice, a zigzag-filter, and a later flattening of the fan change when that advance begins to fail.
- Both the median-line channel and the speed-resistance fan are late-entry maps of support-resistance, not tools for calling the first breakout.
- A median-line channel is fitted to three chosen swings and can be rebuilt when pivots change. Speed-resistance lines stay unique once the high and low are fixed and follow a one-third convention.
- In the 2001 case, a median-line break near the end of December marked the area around 50 that an updated speed-resistance reading later treated as an exit zone, and it reached that neighborhood about three months sooner.
- A 7 percent zigzag-filter on daily highs and lows was used to ignore smaller swings when choosing median-line pivots.
Late-entry maps, not first-breakout tools
Both a three-pivot median-line channel and radiating speed-resistance lines were presented as ways to map support-resistance after a trend is already underway. They were not presented as tools for calling the first breakout.
The chart already has swings and a confirmed advance. The work is to locate support-resistance on that mature trend, not to call whether the first breakout has occurred.
How the two maps are drawn
A median-line channel uses three swings. The center line runs from the first pivot through the midpoint of the next high and low. The outer parallels start at those second and third pivots.
Uptrend speed-resistance lines are drawn from the lowest low to the highest high. A vertical is dropped from the high, that span is divided into thirds, and rays are drawn from the low through those third marks.
Editorial note: both constructions use the same trendline habit in different ways. A slope from significant highs or lows can be copied in parallel, which is how the median-line channel is finished, or radiated as a fan, which is how speed-resistance lines are finished.
The 2001 daily case
In the 2001 daily case, speed-resistance lines were applied only after a sideways pause ended and a new high confirmed the advance. Price was then described as traveling inside the first-third band.
On the later six-month chart, flattening the speed-resistance rays to a new high/low pair was read as slower momentum. Price was near the lower ray. A horizontal band near 50, a narrowing range, and lighter volume were part of that same reading.
On the same case, a median-line channel break near the end of December marked the area around 50 that the updated speed-resistance reading later treated as an exit zone. The median-line map reached that neighborhood about three months sooner.
Pivot choice and the zigzag-filter
A 7 percent zigzag-filter on daily highs and lows was used to ignore smaller swings when choosing median-line pivots. At a price of 45, that filter implied a reversal only after a move of 3.15.
The recap treats speed-resistance lines as longer-lived, unique once the extremes are fixed, and based on a one-third convention. Median-line channels are described as shorter-lived, adjustable by pivot choice, and fitted to an observed retracement.
Home Depot daily price, June 2001–June 2002
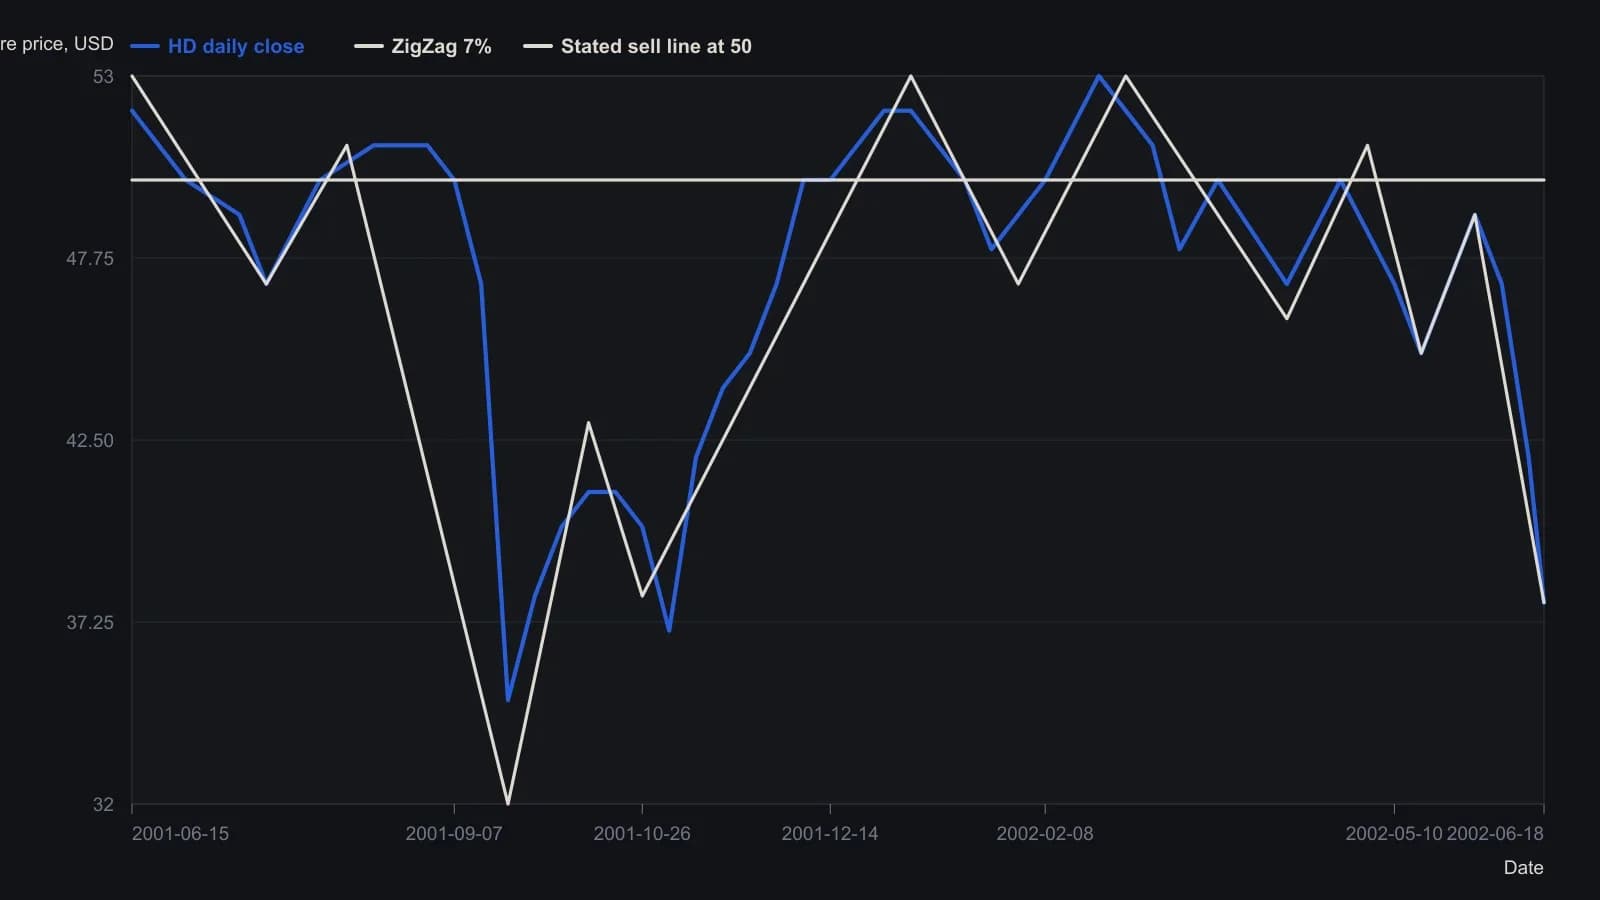
Source zigzag is fixed at 7 percent (about $3.15 near the mid-May 45 print). Closes are digitized to the nearest dollar except that header last print. The October 2001–March 2002 window is read against a two-dollar grid; the rest of the span is read against a five-dollar grid.
What changes when the advance retires
Editorial reading: the two maps do not update on the same rule. The median-line channel can be rewritten by a new three-pivot choice, so the zigzag-filter is there to keep minor swings from changing the map. Speed-resistance lines stay fixed until a new high/low pair is accepted, then the fan is redrawn and a flatter set of rays is read as slower momentum.
The December median-line break and the later speed-resistance exit zone around 50 are the same neighborhood reached on different clocks. That gap is the point of the comparison.
All readings on this track · 19 readings
- 1985Constructing median lines from graded pivots
- 1986Constructing median and action-reaction lines from pivots
- 1989Median line construction from three market turns
- 1990A failed median-line test marks the start of wave three
- 1995Constructing three-pivot median-line channels
- 1996Median-line pitchfork construction for trend and reversal tests
- 2000Nested median-line channels as falsifiable swing tests
- 2002Median-line versus speed-resistance on one trend
- 2003Independent witnesses: a median-line miss, a breadth average, and volume bands
- 2012Constructing oblique trendlines and median-line channels
- 2013Gold futures wave four, competing complexes, and written ratio tests
- 2013The weekly 1-2-3 map as a permission layer
- 2014Measured-move and daily pivot price-projection construction
- 2014Constructing median-line channels from a pivot
- 2016Median-line far parallel as a precommitted exit
- 2017How high is high: Elliott wave landmarks
- 2017A three-layer veto for a suspected third-wave high
- 2020Basic chart rules for Nasdaq trend reversals
- 2020Stacking wave counts, retracements, and median lines