2013issue C1045-46
Gold futures wave four, competing complexes, and written ratio tests
A monthly gold-futures chart from December 10, 2012 through August 15, 2013 treated the decline as an unfinished fourth wave and a complex-correction still working into the 0.382 to 0.618 fibonacci-retracement band. Two lettered counts stayed in view, and each was written to fail on a price or time test.
- The monthly gold-futures decline from December 10, 2012 through August 15, 2013 was treated as an unfinished fourth wave and a complex-correction inside the 0.382 to 0.618 fibonacci-retracement band.
- A W-X-Y double-three aimed at 962 or 898 between September 2, 2015 and May 2, 2016, and was written as invalid if the X wave failed to reach 1524.
- A W-X-Y-XX-Z triple-three aimed at 800 on February 2, 2019 if the Z leg measured 0.618 of the W leg, and was written as invalid unless wave XX matched wave X in both time and price.
- The fourth-wave label required the decline to last at least through September 2, 2015. A shorter span would fail a duration-ratio-test against the prior third wave's 144 bars.
An unfinished fourth wave
A monthly gold-futures chart from December 10, 2012 through August 15, 2013 treated the decline as a still-unfinished fourth wave. The move was read as a complex-correction: a sideways Elliott structure built from two or more corrective patterns joined by connector waves, rather than a single zigzag or flat.
That correction was mapped into the 0.382 to 0.618 fibonacci-retracement band. The band was used as a candidate end zone for the corrective wave, not as a finished destination.
A 5-and-70 oscillator was cited as showing the fourth wave unfinished after only a first move into a 0.9 to 1.4 confirmation band.
Monthly gold futures testing the 0.382 retracement
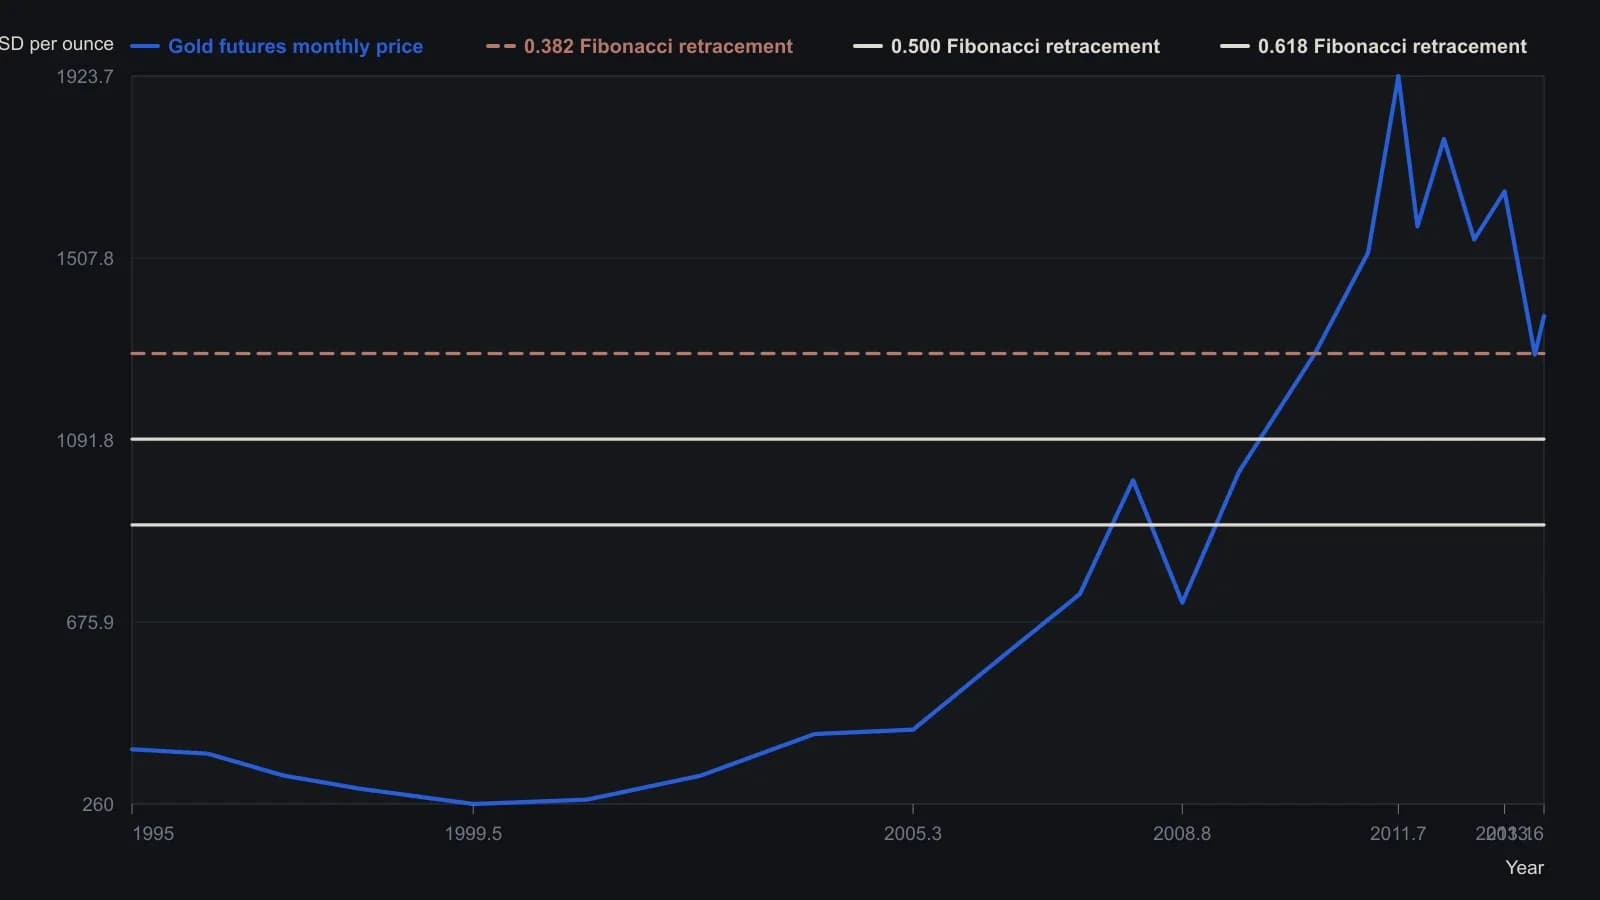
Pre-2011 prices are digitized from candlesticks on a two-hundred-dollar axis and are only good to about ten to twenty dollars. Fibonacci levels use the printed 0.382 / 0.500 / 0.618 retracements of the bull market measured from about 263.9 to 1923.7.
Two complexes on one chart
One count cast the correction as a double-three, a W-X-Y complex in which two corrective patterns are linked by one connector wave. That count aimed at 962 or 898 between September 2, 2015 and May 2, 2016.
A longer count cast the same decline as a triple-three, a W-X-Y-XX-Z complex that adds a second connector and a fifth lettered leg. That count aimed at 800 on February 2, 2019 if the Z leg measured 0.618 of the W leg.
The archive specified both paths. It did not collapse the monthly correction into a single lettered story.
Price and time tests that retire a count
The double-three count was written as invalid if the X wave failed to reach 1524.
The triple-three count was written as invalid unless wave XX matched wave X in both time and price.
The fourth-wave label required the decline to last at least through September 2, 2015. A shorter span would recast the move as a subwave of the third wave because it would cover less than 33.3 percent of that third wave's 144 bars. That comparison is the duration-ratio-test: a bar-count check that drops the fourth-wave label if the decline occupies less than one-third of the prior third wave.
What the tests are for
Editorial reading. The numbered targets, the 1524 X-wave hurdle, the XX-to-X match, and the September 2, 2015 duration floor are the point of the case. They turn a monthly correction into a hypothesis that can be marked wrong on the chart.
A median-line, in this editorial framing, is only the channel behind that overlay. It is a central pitchfork ray through a three-point swing, used to locate a working channel around the wave-and-ratio overlay. It does not replace the written invalidation tests.
All readings on this track · 19 readings
- 1985Constructing median lines from graded pivots
- 1986Constructing median and action-reaction lines from pivots
- 1989Median line construction from three market turns
- 1990A failed median-line test marks the start of wave three
- 1995Constructing three-pivot median-line channels
- 1996Median-line pitchfork construction for trend and reversal tests
- 2000Nested median-line channels as falsifiable swing tests
- 2002Median-line versus speed-resistance on one trend
- 2003Independent witnesses: a median-line miss, a breadth average, and volume bands
- 2012Constructing oblique trendlines and median-line channels
- 2013Gold futures wave four, competing complexes, and written ratio tests
- 2013The weekly 1-2-3 map as a permission layer
- 2014Measured-move and daily pivot price-projection construction
- 2014Constructing median-line channels from a pivot
- 2016Median-line far parallel as a precommitted exit
- 2017How high is high: Elliott wave landmarks
- 2017A three-layer veto for a suspected third-wave high
- 2020Basic chart rules for Nasdaq trend reversals
- 2020Stacking wave counts, retracements, and median lines