1995issue C111-10
Constructing three-pivot median-line channels
A median-line formation is built from three pivot-points. The center line runs from an earlier anchor-pivot through the median-point of a later correction, and two channel-lines are drawn from that correction's extremes, parallel to the same slope.
- A median-line formation is a long center line plus two shorter parallels, and each of the three lines is treated as a candidate support or resistance level.
- The three pivot-points are a low, a later high, and a subsequent low in a rising market, or a high, a later low, and a subsequent high in a falling market.
- The center line starts at an earlier anchor-pivot, passes through the median-point of the corrective high and low, and is extended forward so that it bisects the corrective range.
- Rebuilding after every correction is described as producing confusing or overly steep lines; more stable turns come from a weekly chart transferred to a daily chart, or from end-of-day turns for intraday work.
What a median-line formation is
A median-line formation consists of a long center line plus two shorter parallels. Each of the three lines is treated as a candidate support or resistance level.
On the chart the result has a pitchfork-shape: a long center handle with two shorter parallel outer lines.
Lock three pivot-points
Construction starts from three price pivots. A pivot-point is a high or low where price turns up from a decline or down from a rally. Those turns may be major turning points or smaller turns inside a larger trend.
In a rising market the three pivots are a low, a later high, and a subsequent low. In a falling market they are a high, a later low, and a subsequent high.
Draw the center line and channel-lines
The midpoint that locates the center line is the median-point: the average of the corrective high and the opposing corrective low, obtained by adding those two prices and dividing by two.
The center line is drawn from an earlier anchor-pivot through that median-point and extended forward so that it bisects the corrective price range.
The two channel-lines begin at the original corrective high and low and are drawn parallel to the slope of the extended center line.
December 1994 gold futures through the September peak
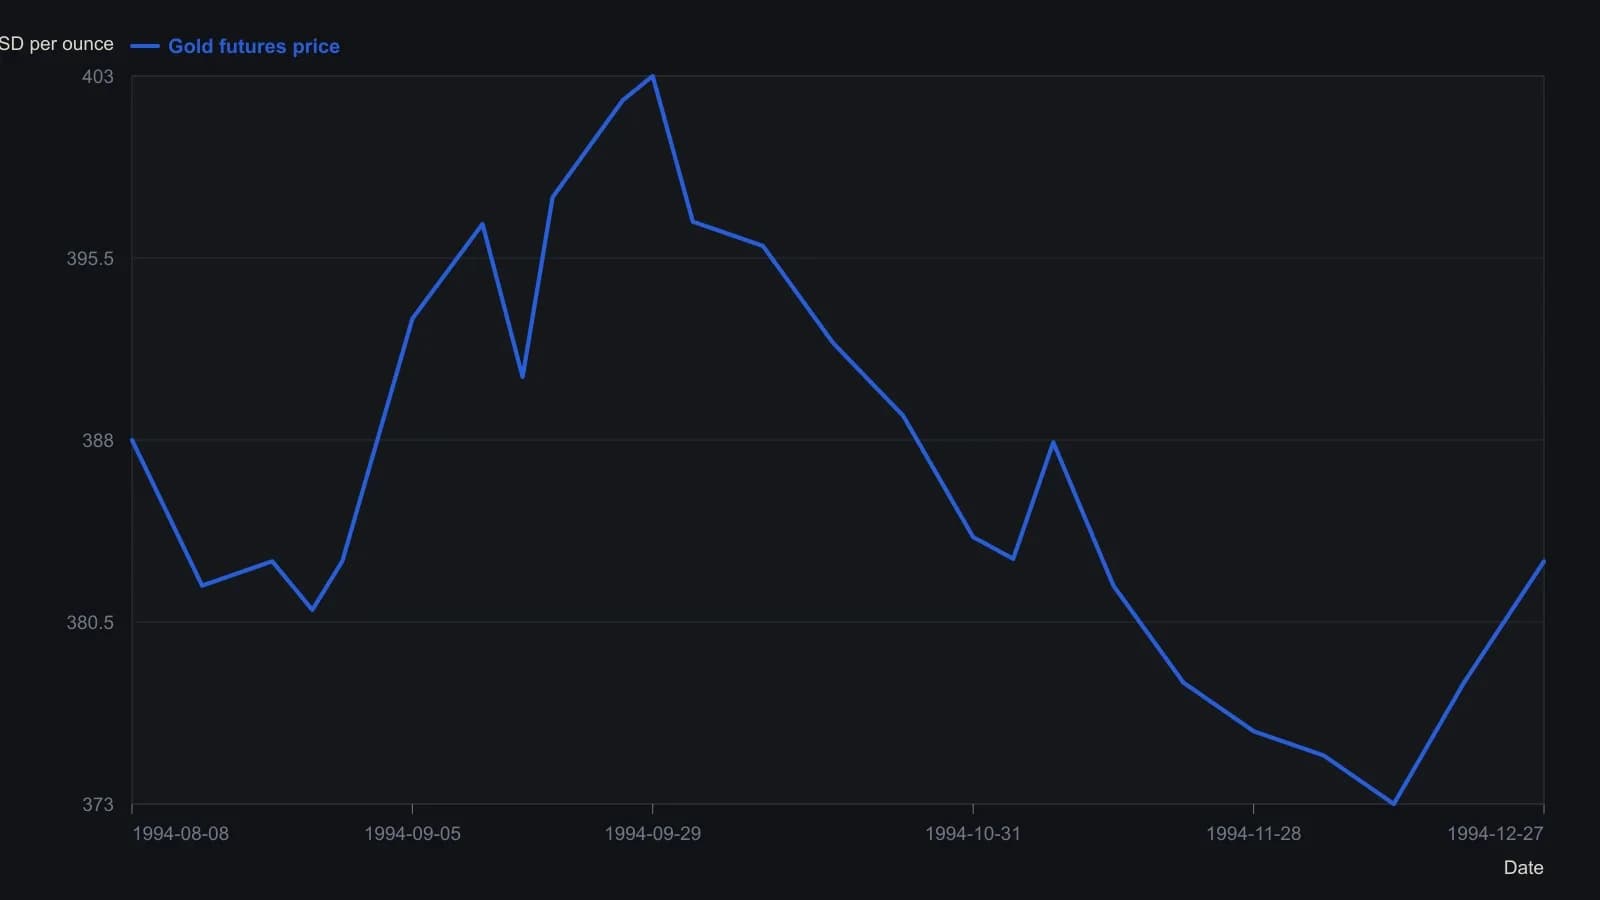
Daily prices are approximate readings from the printed candlesticks, generally to the nearest dollar. The four pivot prices and two medians come from the article’s arithmetic, not from the raster.
Choose more stable pivots
Building a new formation after every correction is described as producing confusing or overly steep lines. More stable pivots are taken from a weekly chart and transferred to a daily chart, or from end-of-day turns for intraday work.
One pivot-selection sequence waits until a potential trend has retested a high or low, a later correction forces a conventional trendline to be re-angled, and price then resumes in the trend direction before the three construction points are locked.
An alternative selection sequence uses a trending swing that travels from one Bollinger band to the opposite band, taking those two extremes plus the origin of the trending move as the three pivots.
All readings on this track · 19 readings
- 1985Constructing median lines from graded pivots
- 1986Constructing median and action-reaction lines from pivots
- 1989Median line construction from three market turns
- 1990A failed median-line test marks the start of wave three
- 1995Constructing three-pivot median-line channels
- 1996Median-line pitchfork construction for trend and reversal tests
- 2000Nested median-line channels as falsifiable swing tests
- 2002Median-line versus speed-resistance on one trend
- 2003Independent witnesses: a median-line miss, a breadth average, and volume bands
- 2012Constructing oblique trendlines and median-line channels
- 2013Gold futures wave four, competing complexes, and written ratio tests
- 2013The weekly 1-2-3 map as a permission layer
- 2014Measured-move and daily pivot price-projection construction
- 2014Constructing median-line channels from a pivot
- 2016Median-line far parallel as a precommitted exit
- 2017How high is high: Elliott wave landmarks
- 2017A three-layer veto for a suspected third-wave high
- 2020Basic chart rules for Nasdaq trend reversals
- 2020Stacking wave counts, retracements, and median lines