2003issue C071-3
Independent witnesses: a median-line miss, a breadth average, and volume bands
Single technical measures often issue false buy and sell alerts, so they are routinely read in sets. This archive lesson pairs a median-line channel miss with a breadth moving average and a volume-volatility squeeze, and it labels as editorial the rule that those witnesses must come from different inputs.
- Single technical measures often issue false buy and sell alerts, so they are routinely read in sets rather than in isolation.
- Pairing price-pattern counts with a market-breadth series uses two independent data sources instead of restating the same price path.
- Editorial reading: treat a median-line channel miss as structure, a breadth moving-average regime as market mindset, and a volume-band squeeze as readiness.
- A lower-channel miss without a contemporaneous volume-volatility squeeze was treated as an incomplete setup; a later squeeze at a pivot valley was the independent timing cue.
Why single measures are read in sets
Single technical measures often issue false buy and sell alerts, so they are routinely read in sets rather than in isolation. One line or one envelope is not treated as a finished reading.
A bullish flag is expected to show expanding volume into the formation, quieter volume inside it, and expanding volume on an upside breakout. Price shape and volume are already two observations, not one drawing restated twice.
Wedges compress both price range and volume. NR4 sessions and Bollinger-style contractions on volume are described as that same compression written as a pattern. Pairing price-pattern counts with market-breadth series is framed as using two independent data sources rather than restating the same price path.
A median-line miss as a structural hypothesis
After a major or intermediate high or low, a median line is drawn through the midpoint of the next pivot peak and valley. Parallels through those pivots form the upper and lower channels. The three-line frame is a pitchfork, and later swings are judged by whether price completes or misses a channel.
If price fails to touch one channel, the missed distance is expected to appear as a comparable overshoot of the opposite channel because the trend slope has changed. That miss is the structural hypothesis. It is not, by itself, a complete setup.
A breadth average as market mindset
A moving average is a lookback mean of an ordered series. Here it is applied to market breadth: the difference between 52-week new highs and new lows. When that average is negative and declining, it is treated as a bearish market-mindset reading.
When the breadth average turned higher while only bearish wedges were present and bullish wedges were absent, the pattern set was used to keep a still-bearish reading of market mood. The price-pattern count and the breadth series were kept as separate witnesses. A pause in one did not rewrite the other.
Volume bands as a readiness squeeze
Bollinger bands are an envelope around a moving average at a stated multiple of recent standard deviation. The same envelope idea is applied to volume or up-volume, so a squeeze marks a contraction in activity volatility rather than a price envelope.
Volume-volatility is a Nasdaq up-volume series smoothed with a short moving average and wrapped in standard-deviation bands. Contractions of that band width are read as squeezes: quieting activity that may precede a larger swing, seen independently of the price path.
A wedge already compresses range and volume. An NR4 session is treated as a compression event that often appears inside wedges. Those price-path compressions are not a substitute for the volume-volatility squeeze.
When one witness is missing
A lower-channel miss without a contemporaneous volume-volatility squeeze was treated as an incomplete setup. A later squeeze at a pivot valley was the independent timing cue that a compensating swing might be ready.
The archive pairing is price structure with a breadth or volume series. Editorial reading: do not count a median line, a moving average, and bands drawn on the same close series as three witnesses. The test holds only when structure, mindset, and readiness are measured on different inputs.
Nasdaq 20-day breadth average stayed negative into 2001
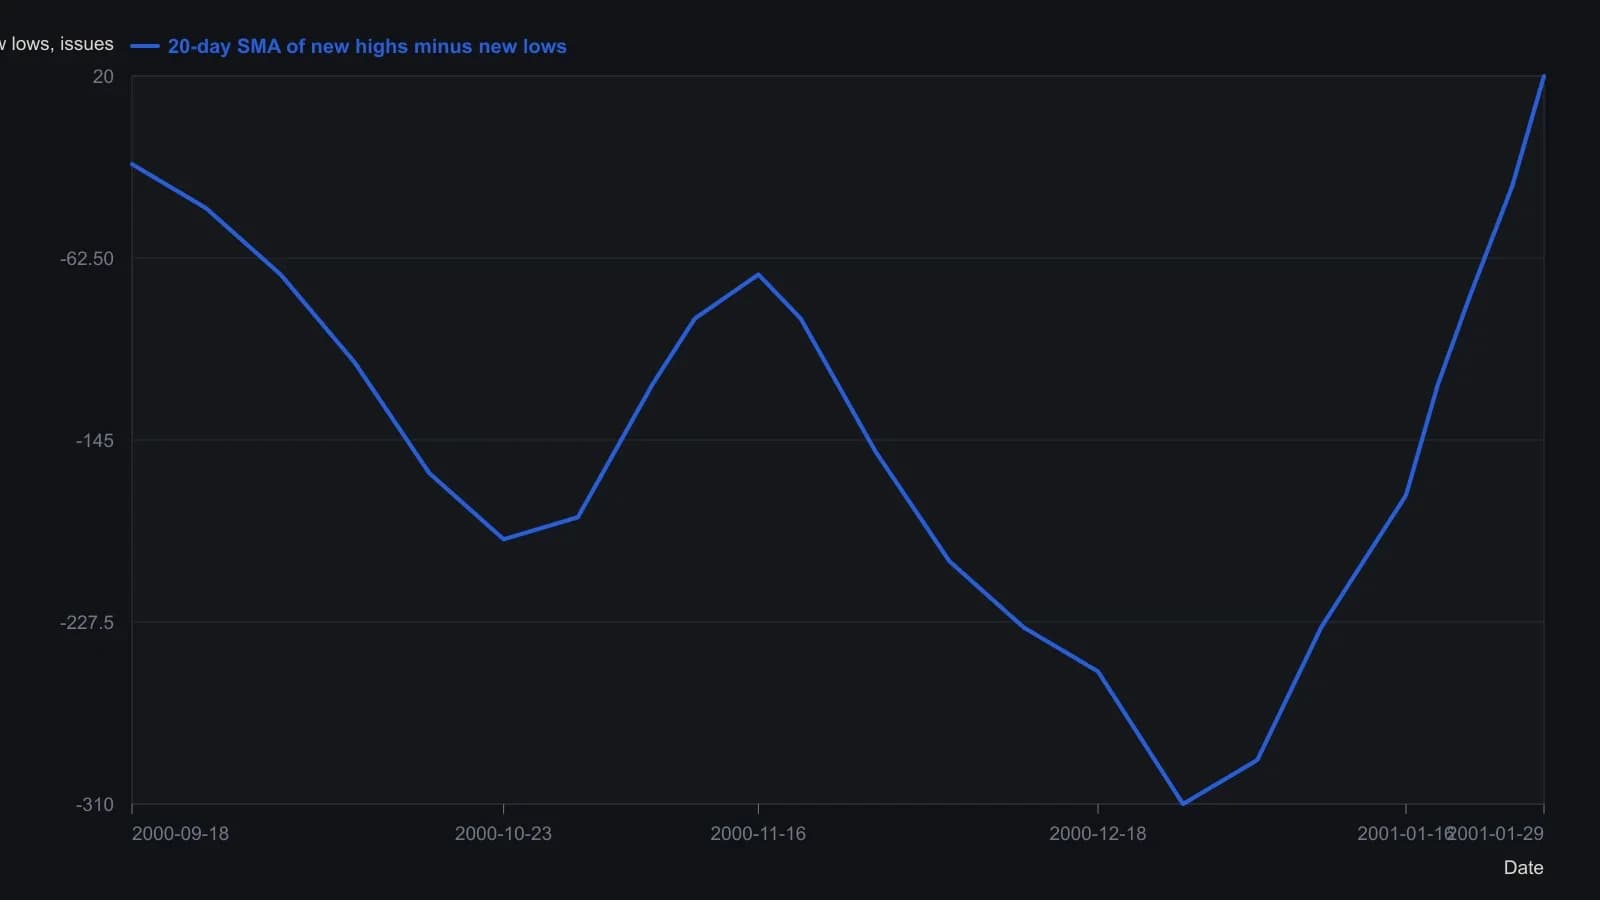
Peterson plots a 20-day simple moving average of the daily difference between 52-week new highs and 52-week new lows. Points were read from the raster against the 0 / −100 / −300 scale and rounded to the nearest ten issues.
All readings on this track · 19 readings
- 1985Constructing median lines from graded pivots
- 1986Constructing median and action-reaction lines from pivots
- 1989Median line construction from three market turns
- 1990A failed median-line test marks the start of wave three
- 1995Constructing three-pivot median-line channels
- 1996Median-line pitchfork construction for trend and reversal tests
- 2000Nested median-line channels as falsifiable swing tests
- 2002Median-line versus speed-resistance on one trend
- 2003Independent witnesses: a median-line miss, a breadth average, and volume bands
- 2012Constructing oblique trendlines and median-line channels
- 2013Gold futures wave four, competing complexes, and written ratio tests
- 2013The weekly 1-2-3 map as a permission layer
- 2014Measured-move and daily pivot price-projection construction
- 2014Constructing median-line channels from a pivot
- 2016Median-line far parallel as a precommitted exit
- 2017How high is high: Elliott wave landmarks
- 2017A three-layer veto for a suspected third-wave high
- 2020Basic chart rules for Nasdaq trend reversals
- 2020Stacking wave counts, retracements, and median lines