2000issue C121-6
Nested median-line channels as falsifiable swing tests
Three successive turning-points define a median-line and an angled price-channel. As later swings confirm, a nested-fork replaces the last construction and writes a new price-time-target.
- Three successive turning-points define a median-line; parallels through the later two form a price-channel for the expected travel zone after the third turn.
- A symmetrical first return to the median-line yields a price-time-target. Later confirmed swings produce a nested-fork that replaces the prior construction.
- A close through the lower parallel after a projected high, or a ride along the upper parallel, retires the working fork even if a later swing still lands on the old date.
- Match fork points by swing size. A session pierce of a steep, narrow channel need not cancel the larger swing; after a smaller cycle is exhausted, the next larger three-point set remains the support-resistance map.
Three turning-points make the fork
Three successive significant highs and lows define a median-line. The last two turning-points are joined, their midpoint is marked, and a line is projected from the first turning-point through that midpoint and extended forward.
Parallel lines through the second and third turning-points, drawn at the same slope as the median-line, form an angled price-channel. After the third turning-point, price is expected to travel along the near parallel or between that parallel and the median-line.
The price-time-target
Under a symmetrical reaction, the first return to the median-line is expected at a distance from the midpoint equal to the distance from the first turning-point to the midpoint. That joint price-and-time objective is the price-time-target.
As later turning-points confirm, a new fork is drawn from the latest three pivots. Successive median-line channels then nest, and the nested-fork projects the next objective.
Nasdaq Composite, Dec 1999–May 2000, with nested Andrews targets
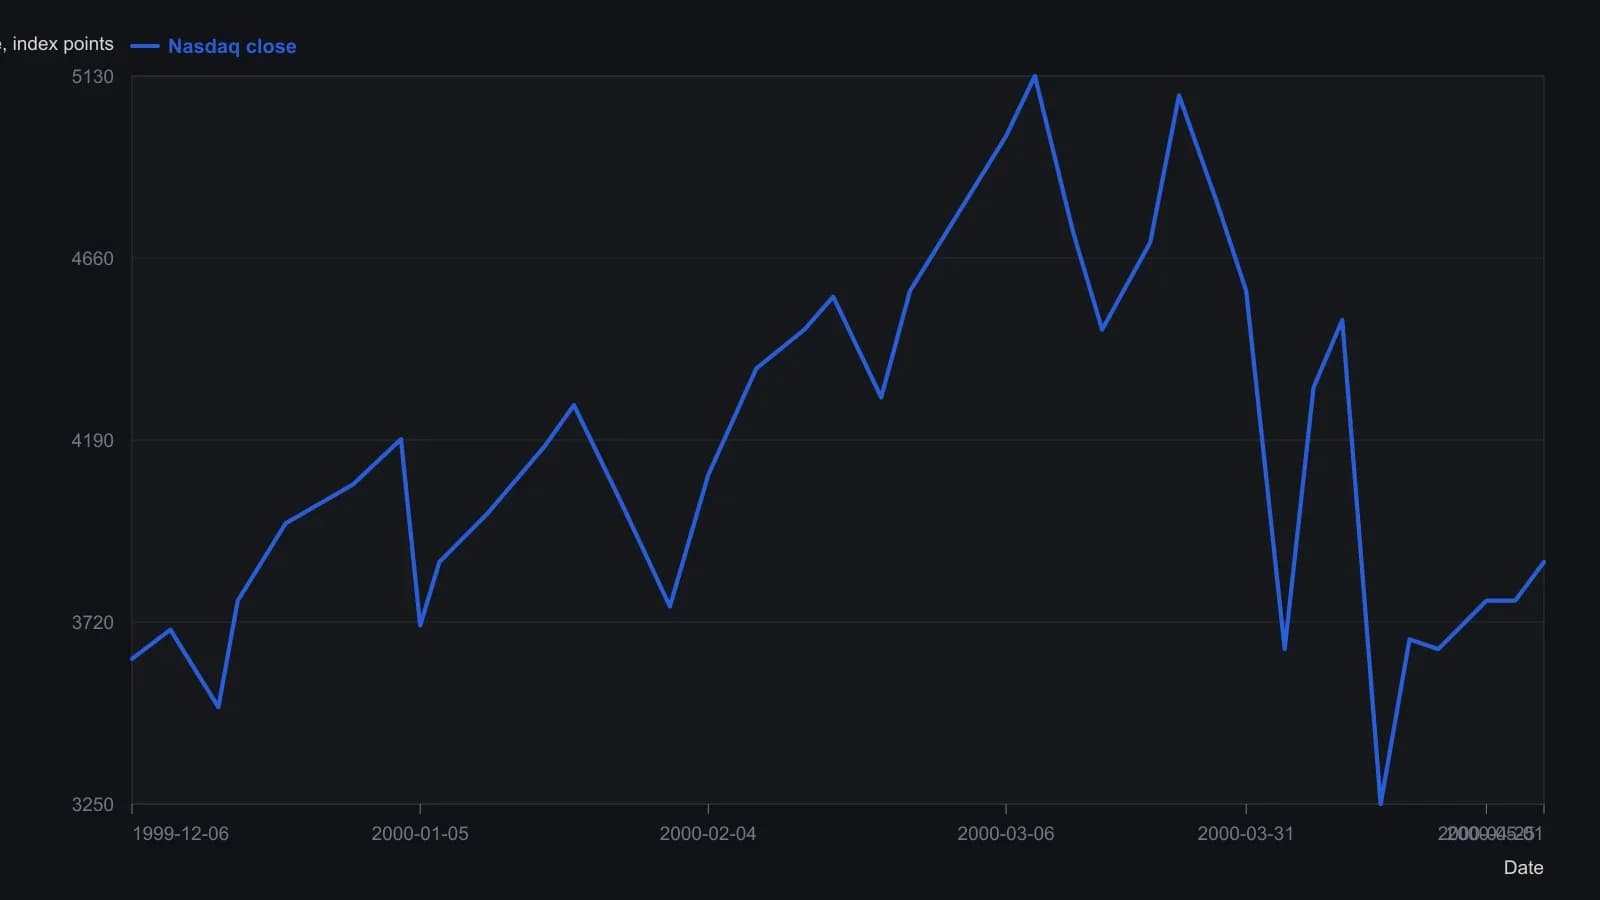
Closes digitized from the candlestick pane to the nearest 25 index points except the two prices Chandler printed (E = 4192, F = 3711). Pitchfork rays themselves are construction lines, not a plotted series.
What retires a working fork
A close through the lower parallel after a projected high is treated as confirmation that the high is complete and that a new three-point set should replace the prior fork.
When price charges through the median-line and rides the upper parallel, the original price-time-target is treated as obsolete even if the calendar date of the target still coincides with a later swing.
The median-line and its parallels act as support-resistance. A hold, tag, or close-through confirms or retires the working fork.
Nested cycles and swing size
Steep median-line channels are narrow and can be pierced inside a session without canceling the larger swing. Fork points should be matched by swing size rather than mixed across cycles.
After a smaller cycle is exhausted, zooming out to the next larger three-point set can produce a later objective that is reached near both the projected date and price, even when the smaller-cycle median-line has already been broken.
In a sharp decline, price can bypass median-line targets while remaining inside the outer parallels, so the channel boundaries remain the working support-resistance map.
All readings on this track · 19 readings
- 1985Constructing median lines from graded pivots
- 1986Constructing median and action-reaction lines from pivots
- 1989Median line construction from three market turns
- 1990A failed median-line test marks the start of wave three
- 1995Constructing three-pivot median-line channels
- 1996Median-line pitchfork construction for trend and reversal tests
- 2000Nested median-line channels as falsifiable swing tests
- 2002Median-line versus speed-resistance on one trend
- 2003Independent witnesses: a median-line miss, a breadth average, and volume bands
- 2012Constructing oblique trendlines and median-line channels
- 2013Gold futures wave four, competing complexes, and written ratio tests
- 2013The weekly 1-2-3 map as a permission layer
- 2014Measured-move and daily pivot price-projection construction
- 2014Constructing median-line channels from a pivot
- 2016Median-line far parallel as a precommitted exit
- 2017How high is high: Elliott wave landmarks
- 2017A three-layer veto for a suspected third-wave high
- 2020Basic chart rules for Nasdaq trend reversals
- 2020Stacking wave counts, retracements, and median lines