2017issue C1224-29
A three-layer veto for a suspected third-wave high
Editorial reading: treat a suspected third-wave high as a three-layer veto. Elliott structure names the swing, a time-price rectangle and Fibonacci grid size it, and a median-line or channel failure is required before the high is treated as complete.
- In a non-overlapping impulse, wave three is treated as the strongest leg and cannot be the shortest. The count is treated as underway only after that leg exceeds the length of wave one.
- A baseline time-price rectangle maps wave three as 1.618 times wave one on both axes. A 2.0 to 2.618 multiple is framed as an extended wave three, and a 1.0 to 1.50 multiple as a failed wave three.
- Inside the rectangle, reversals cluster where Fibonacci ratios coincide on both axes. Channels and median-line layouts are stacked so a failed test of an upper median line or trigger line can occupy the same location.
- A conservative entry waits for the first internal retracement to end and a prior subwave high to break, then trails with a 14-period ATR stop that shrinks toward one-quarter of its value in the terminal fifth subwave.
A three-layer veto
Editorial reading: treat a suspected third-wave high as a three-layer veto drill. Elliott structure names the swing. A time-price rectangle and Fibonacci grid size it. A median-line or channel failure is required before the high is treated as complete.
The archive facts describe a historical workflow that stacks those three checks. They do not claim present-day performance.
Elliott structure names the swing
In a non-overlapping impulse, wave three is treated as the strongest leg and is not allowed to be the shortest. The count is treated as underway only after that leg exceeds the length of wave one.
If wave one and wave three are equal in length, the count either anticipates an extended fifth wave or is relabeled so the supposed third wave becomes a C-wave of a correction.
The time-price rectangle sizes the swing
A baseline time-price rectangle maps wave three as 1.618 times wave one on both axes. A 2.0 to 2.618 multiple is framed as an extended wave three. A 1.0 to 1.50 multiple is framed as a failed wave three.
Equal time and price parameters produce a 45-degree rectangle diagonal. Time shorter than price yields a tall rectangle with a steeper diagonal. Time longer than price yields a wide rectangle with a flatter diagonal.
The rectangle diagonal is used as a symmetry axis near 45 degrees, as support on a 45-to-60-degree slope, or as resistance on a slope below 45 degrees. Those three uses match average, strong, or weak wave-three momentum.
Internal retracements and confluence
A Fibonacci retracement grid is drawn from a prior swing so pullbacks and time-price crossings can be checked against fixed multiples such as 0.382, 0.50, 0.666, and 1.618.
Inside a wave-three rectangle, the second subwave often retraces about 66.6 percent of the first subwave and the fourth about 38.2 percent of the third. Reversals cluster where Fibonacci ratios coincide on both axes. That coincidence is treated as time-price confluence.
One illustrated wave-three completion sat at time-price coordinates 1.166 and 1.75 relative to wave one, with price slightly above the 1.618 ratio and time below it.
A conservative entry and a shrinking trail
A conservative entry is a later third-wave entry taken only after wave-two context and a confirming breakout, with a pre-fixed stop behind a swing, gap, or one ATR(14).
One historical conservative entry sat at 11942 after the first internal retracement ended and the prior subwave high broke. The stop sat under that bar's low at 11934. Later add-ons used breaks of 11956, 11977, and 11993.
Planned exits used a trailing ATR stop. The trail starts at the full 14-period ATR and is reduced to 75 percent, 50 percent, and 25 percent as the move matures. The smallest value is reserved for the terminal fifth subwave.
FDAX levels used to buy and pyramid wave three
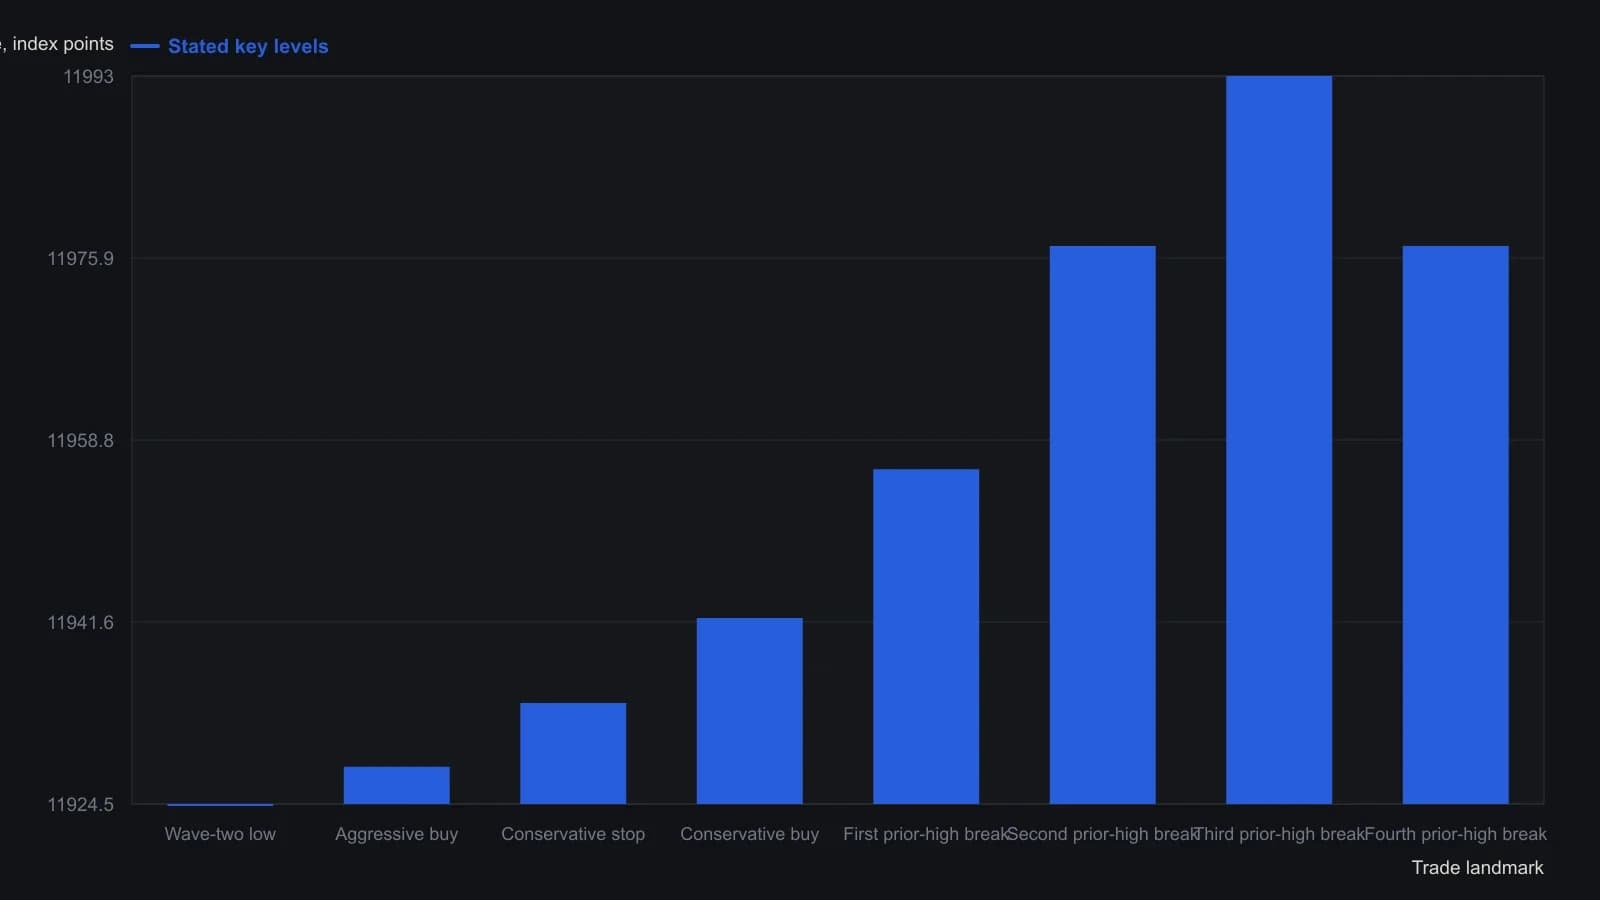
FDAX 15-minute session of 22–23 March 2017. Wave two of the setup is stated as half of wave one. The later 11977 add-on is a second break of that same prior high after a pullback, not a new price.
Median-line failure as the last check
Channels, regional pitchforks, and action-reaction median-line layouts are stacked with Fibonacci ratios, arcs, and rectangle extensions. The median line is the center line of a pitchfork or action-reaction layout, used with warning lines and trigger lines to test whether a wave-three high is still advancing or has failed.
A failed test of an upper median line or trigger line can occupy the same location as a wave-three reversal cluster. Editorial reading: that failed test is the third veto, and the high is not treated as complete until it appears.
All readings on this track · 19 readings
- 1985Constructing median lines from graded pivots
- 1986Constructing median and action-reaction lines from pivots
- 1989Median line construction from three market turns
- 1990A failed median-line test marks the start of wave three
- 1995Constructing three-pivot median-line channels
- 1996Median-line pitchfork construction for trend and reversal tests
- 2000Nested median-line channels as falsifiable swing tests
- 2002Median-line versus speed-resistance on one trend
- 2003Independent witnesses: a median-line miss, a breadth average, and volume bands
- 2012Constructing oblique trendlines and median-line channels
- 2013Gold futures wave four, competing complexes, and written ratio tests
- 2013The weekly 1-2-3 map as a permission layer
- 2014Measured-move and daily pivot price-projection construction
- 2014Constructing median-line channels from a pivot
- 2016Median-line far parallel as a precommitted exit
- 2017How high is high: Elliott wave landmarks
- 2017A three-layer veto for a suspected third-wave high
- 2020Basic chart rules for Nasdaq trend reversals
- 2020Stacking wave counts, retracements, and median lines