2002issue C071-4
Trader net positions as regime context for chart setups
Treat a single chart condition, including a double top, as one trade inside a participant regime. Overlay commercial, noncommercial, and small-trader net-position change so the question is who is buying or selling, and whether that flow agrees across related markets.
- Compare commercial, noncommercial, and small-trader net-position change to see whether each group is adding or reducing longs or shorts.
- A reading above zero is net long and a reading below zero is net short; that zero line can serve as a simple directional bias.
- Treat a chart condition such as a double top as one trade inside that participant regime, not as a pattern that stands alone.
- In related grain markets the useful observation was whether large traders were buying or selling versus small traders, not which group was already net long or net short.
One trade inside a participant regime
Editorial habit for weeks-to-months futures work: treat a single chart condition, including a double top, as one trade inside a participant regime. A commitment-of-traders split of futures holdings into commercial, noncommercial, and small-trader groups is used to read that regime from who is adding or reducing exposure.
Commercial, noncommercial, and small-trader groups typically hold futures for different reasons, so comparing each group's net-position change shows whether that group is adding or reducing longs or shorts. Commercials are described as using futures mainly to stabilize underlying price exposure, while noncommercials and small traders generally hold positions to speculate on contract prices.
Net-position and the zero line
A net-position is the signed long-minus-short holding of one trader group. On a net-position plot, a reading above zero marks a trader group as net long and a reading below zero marks it as net short.
COMEX gold net positions by trader group, 2001–early 2002
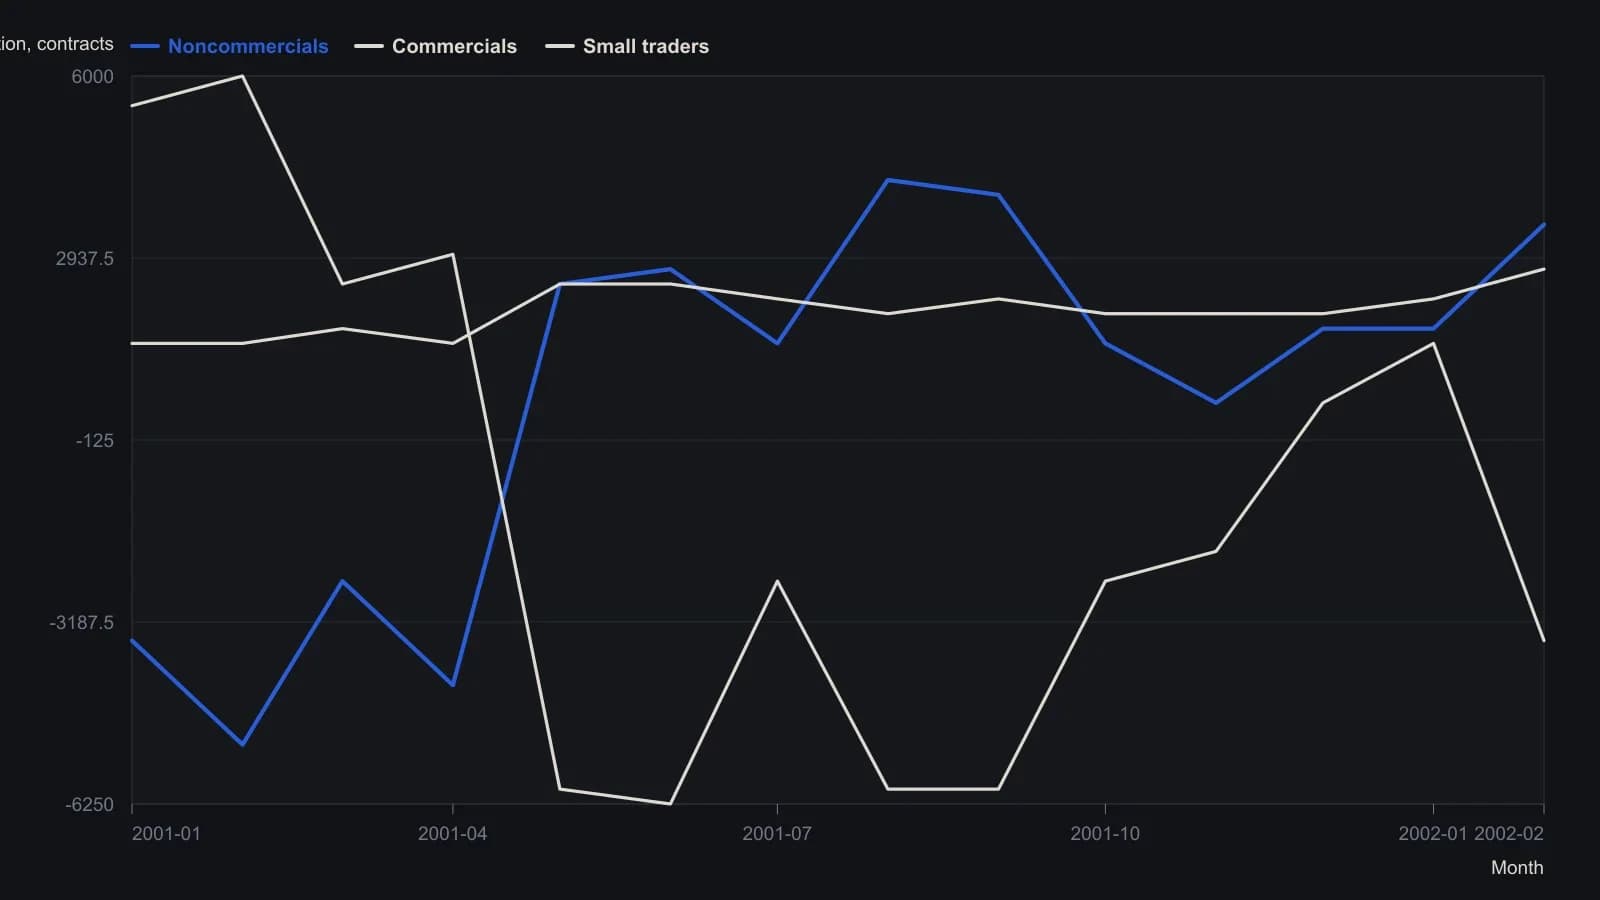
Weekly net-position levels read off the published COMEX gold pane. Axis ticks are 1,000-contract increments; readings are rounded to the nearest 250 contracts and are approximate. The magenta trendlines on the source pane are not plotted. Price is omitted because it does not share the contract-count scale.
Gold and yen as directional overlays
In the COMEX gold case, noncommercial net-position trend served as a directional overlay. An intermediate divergence versus price from May through September 2001 preceded a later decline, and noncommercials were net long before an early-January 2002 advance.
A yen case used the noncommercial zero line as a simple bias cue: net short below zero, net long above zero. The same case noted that small traders often shared that same directional stance.
Large versus small flow in related markets
Market-participant-analysis compares large-trader versus small-trader buying and selling so one contract is judged in a regime-aware, cross-market context instead of as an isolated idea.
When commercials and noncommercials sold together while small traders bought, the crude-oil, corn, and soybean cases treated that alignment as a large-versus-small transfer into a peak or into a later decline. In the grain examples, the relevant observation was whether large traders were buying or selling versus small traders, not which group was already net long or net short. Corn and soybeans showed similar large-trader selling while prices were still rising.
Editorial note: that shared grain window is a related-market-setup, the tendency of contracts in the same commodity complex to show similar large-versus-small flow in the same window.
A double top inside equity-index flow
Because equity-index futures have no deliverable commodity, the illustrated S&P 500 case treated the market as mainly commercials versus small traders. It read a March 2001 commercial shift from adding shorts to buying, while still net short, as a change in participant momentum.
An October 2001 double-top structure on the S&P 500 coincided with commercials adding to shorts ahead of a January to February 2002 decline. At an early-March 2002 rally high, both large-trader groups were adding shorts while small traders were adding longs.
A double top is a two-peak price structure treated as a falsifiable chart hypothesis that can be checked against contemporaneous participant flow. Editorial habit: the pattern does not stand alone. The overlay asks whether commercials, noncommercials, and small traders are buying or selling with it.
Commitment and later price tendencies
Trend direction in each group's net positions, and reversals at extreme net-position levels, were presented as a way to read commitment and later price tendencies in a zero-sum futures market.
All readings on this track · 20 readings
- 1990Constructing a COT index from the commercial-speculative spread
- 1990Crowded price rules need abstention and a regime overlay
- 1991Advisor consensus fails as weekly contrarian timing
- 1996When speculative flows decouple bonds from stocks
- 1996Score each trader class against itself, then slice by month
- 1996Pork belly Commitment of Traders signals depend on the seasonal window
- 2002Constructing regime context from trader commitment nets
- 2002Trader net positions as regime context for chart setups
- 2003Three states for a daily futures advisor consensus
- 2005Commitment of Traders open-interest extremes as regime filters
- 2005Commitment of Traders participant imbalance as regime context for commodity position trades
- 2006Housing slowdown as a cross-market regime lesson
- 2007Evaluate an index stance as a spread between trader books
- 2011Constructing weekly participant positioning ledgers
- 2012Commitment of Traders as crowded-book context, not a copy signal
- 2014When Commitment of Traders smart money fails as an intermarket regime filter
- 2014Constructing Commitment of Traders regime context when commercial hedgers fail
- 2015Leave a yen bottom unconfirmed until gold and positioning agree
- 2016Stacking volume, open interest, and trader books around expiration
- 2025Post-crash cash and regime-aware watchlists