1989issue C091-5
T-bond volume-price boxes and a withheld rectangle top
A 1989 T-bond range is read as daily volume-price boxes of range versus participation. The archive workflow withholds a top until sellers later leave the rectangle through support on increasing volume.
- A volume-price box draws each session with height equal to that day's range and width equal to that day's volume, so travel and participation appear in one shape.
- A tall, narrow box is read as light volume and relatively easy price travel. A wide, short rectangle is read as heavy volume with little price progress.
- Climactic volume is not labeled a reversal on the day it prints. A reversal is considered only if price later fails to continue in the direction that produced the spike.
- A rectangle top is inferred only after sellers push below the holding area on increasing volume, not while price stays inside the range on lighter boxes.
Sessions as volume-price boxes
Volume-price analysis reads each session as a box of price range versus participation to judge whether demand or supply is expanding. Price stays on the vertical axis, and each session's total contract volume is plotted on the horizontal axis, so the day appears as a volume-price box whose width is participation and whose height is the session range.
A tall, narrow box is interpreted as light volume and relatively easy price travel. A wide, short rectangle is interpreted as heavy volume with little price progress. The working premise is that volume usually expands when price travels with the prevailing trend, while light-volume countertrend sessions indicate the opposing side is not attracting participation.
Volume scale on this T-bond chart
The T-bond construction uses a volume scale of 25,000 contracts per horizontal unit. Night-session price and volume are excluded because those prints are typically disproportionately small.
January boxes and a short-term uptrend
After a three-session decline beginning 3 January 1989, the 6 January session reversed and closed at its high slightly above the prior three-day highs without a dramatic widening of the box. From 9 January through 12 January, boxes then narrowed on sideways trade and widened on the advance. That stretch was treated as a short-term uptrend while that volume-price relationship persisted.
A rectangle that is not yet a top
The 18 January session produced the largest volume seen to that point and a rectangular box. Price then held inside that range on lighter volume. A rectangle pattern is a multi-session holding area whose later resolution is judged by whether price leaves the range on expanding or contracting box width. A top was to be inferred only if sellers later pushed below the range on increasing volume.
Support and resistance are the recently defended lows and highs that define the rectangle. A break is confirmed only when the opposing side produces a wider box through that boundary.
February: support fails on a large box
On 8 February a narrow-range, relatively large-volume rectangle followed a light-volume rally off support. On 9 February price traded through support on a large box and closed on the lows, which was read as a completed top and a downtrend.
The next four sessions made lower prices on shrinking boxes, treated as an oversold pause rather than expanding supply. The 16 to 21 February bounce stayed light-volume with clustered closes, so demand was still judged weak and the downtrend intact.
June 1989 T-bond day-session volume, 3–27 January
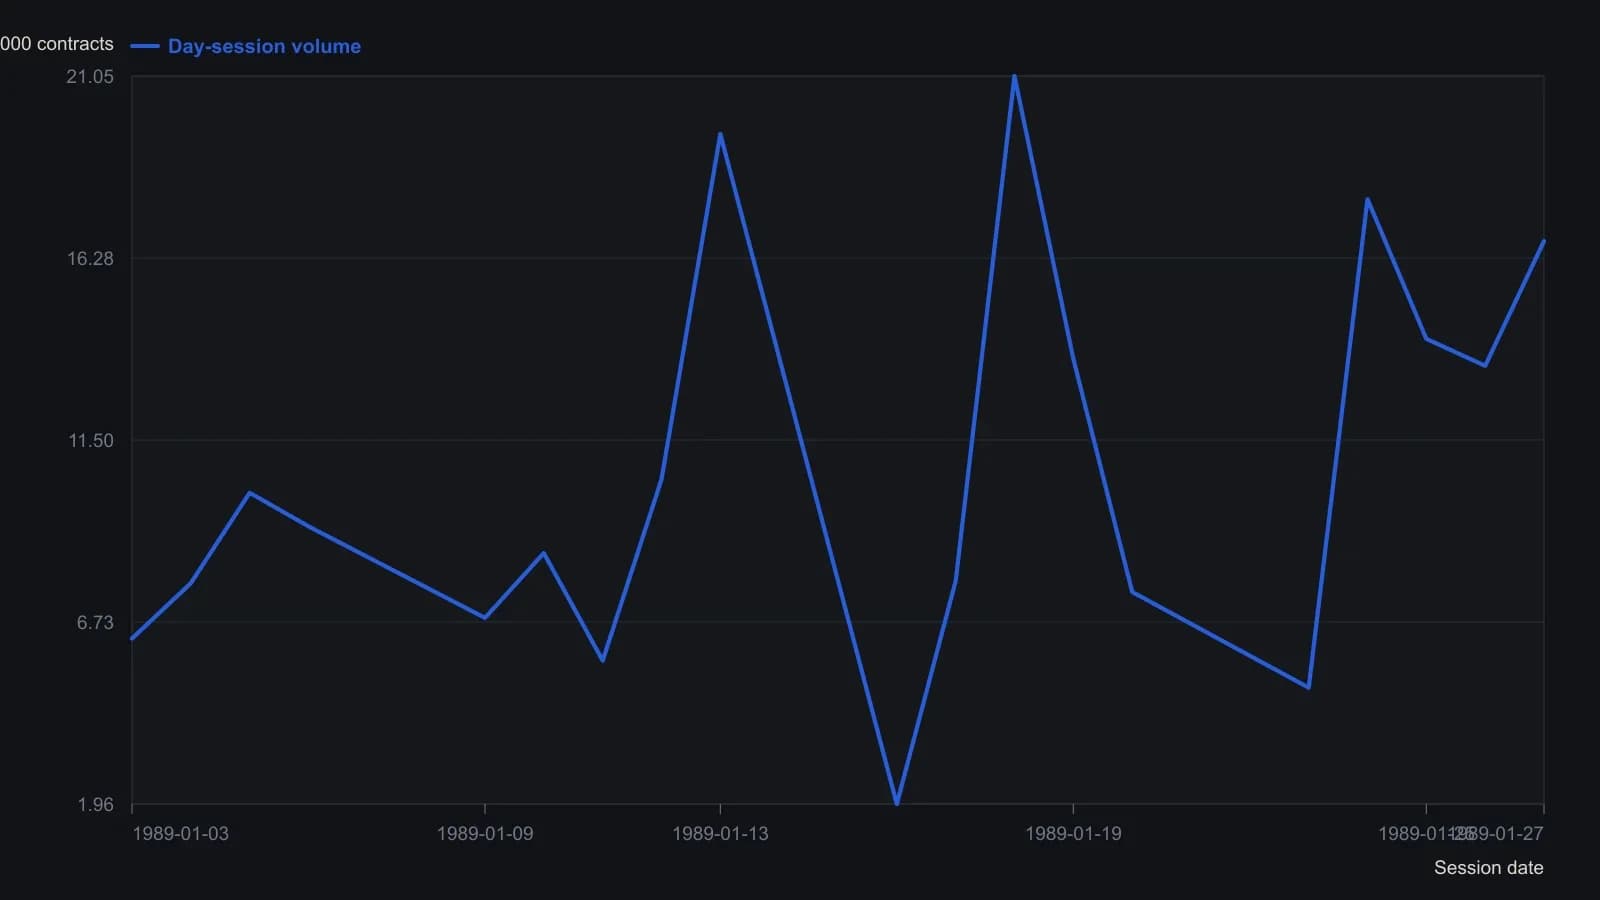
Night-session price and volume are omitted. Printed box totals are day-session contracts divided by 25,000.
All readings on this track · 19 readings
- 1989T-bond volume-price boxes and a withheld rectangle top
- 1990Constructing ease of movement from volume-scaled boxes
- 1990Weekly four-stage mapping with average, range, and volume
- 1996Constructing volume-confirmed average-cross entries
- 1996Constructing four MFI bar states from range and volume
- 2001Building in-gear volume-price overlays
- 2004Constructing index volume for price-volume signals
- 2004Auditing volume-on-retest rules for prior highs and lows
- 2004Wait-rule collapse in a mistaken sale cascade
- 2005Constructing a volume and change weighted moving average
- 2005Daily average support and Friday volume holds
- 2007Match a volume-price oscillator to a range, not to a policy rebound
- 2008Volume confirms chart pattern breakouts
- 2011Color-coded volume bars for rule-based swing entries
- 2012Go or no-go checklist at repeated resistance
- 2012Pocket-pivot volume rules before a later breakout
- 2014Constructing defended price lines from volume spikes
- 2016Closing score from range location as a volume-checked sentiment filter
- 2019Volume follows price as auction state