1990issue C051-7
Constructing ease of movement from volume-scaled boxes
Ease of movement is built from session geometry before it is read as a center-line test. Each session is a volume-scaled box, that shape becomes a box ratio, the midpoint move is scaled by the ratio, and only the normalized ease average is then judged above or below a center line.
- Volume is read against the session trading range, not as an isolated total, and that pairing is drawn as a volume-scaled box.
- Box ratio is the volume number divided by the range number, midpoint move is the change in session medians, and the ease-of-movement value is the midpoint move divided by the box ratio.
- Raw ease-of-movement values are too erratic to use directly and cannot be compared across instruments until they are smoothed and turned into a normalized ease average.
- On the 13-session normalized ease average, a reading above the center line is treated as easier upside travel and a reading below it as easier downside travel, though the series can lag or hover without a decisive reading.
Read volume against the session range
An easy advance is expanding upside range with rising volume. The pullbacks that interrupt that advance show the opposite pairing: lighter volume and tighter ranges.
Volume is not read as a standalone total. It is compared with the same session trading range, so the same volume print is not treated the same on a wide range as on a narrow one.
Each session as a volume-scaled box
When volume is placed on the horizontal axis, each session becomes a rectangle. Height is the price range and width is volume, so the shape itself encodes travel relative to activity. That rectangle is the volume-scaled box.
A tall thin volume-scaled box marks large price travel on comparatively light volume. A short wide volume-scaled box marks small travel relative to the volume expended.
Box ratio, midpoint move, and the ease-of-movement value
Box ratio is the volume number divided by the range number. A lower box ratio corresponds to easier travel, meaning price traveled more freely for the activity expended. A square session, where those two numbers match, yields a box ratio of 1.
Midpoint move is today’s median price minus yesterday’s median price. Each median is the session high plus the session low, divided by two.
The ease-of-movement value is the midpoint move divided by the box ratio. A given displacement on lighter volume therefore produces a larger reading than the same displacement on heavier volume. Light, easy travel is enlarged. Heavy, hard travel is shrunk.
Smooth the raw series and normalize the scale
Raw ease-of-movement values are described as too erratic for use. They are smoothed with a 13-session moving average selected by trial and error. Other lookbacks may be substituted.
Because the unnormalized calculation depends on each instrument’s price level and volatility, readings cannot be compared numerically across instruments until they are normalized. The series used after that step is the normalized ease average: a scale-adjusted, smoothed ease-of-movement series against which a center line can be judged and across which instruments can be compared.
What the center line is allowed to claim
On the 13-session normalized ease average, readings above the center line are treated as easier upside travel and readings below it as easier downside travel. The series can also lag or hover near the center line without a decisive reading.
That center-line contrast is available only after the volume-scaled box, the box ratio, and the midpoint move have already been built. The construction comes first. The reading is a later claim about the finished series.
13-day ease of movement versus the center line
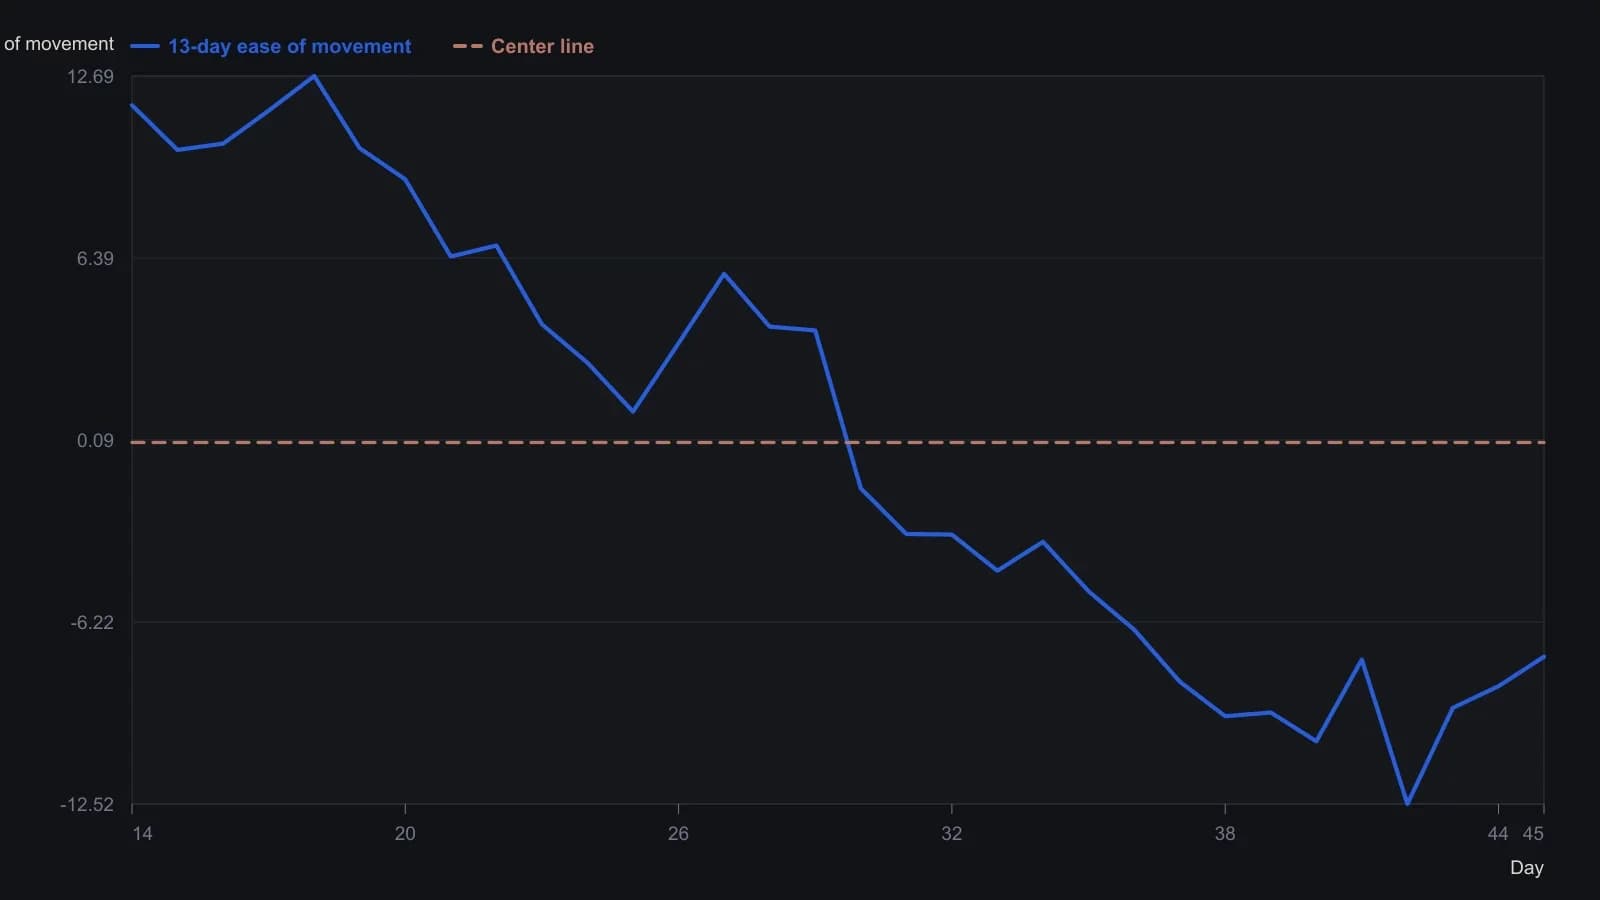
The 13-day column is a 13-session sum of daily ease (midpoint move divided by box ratio) and first appears on day 14. Range is expressed in eighths before the box ratio is formed.
All readings on this track · 19 readings
- 1989T-bond volume-price boxes and a withheld rectangle top
- 1990Constructing ease of movement from volume-scaled boxes
- 1990Weekly four-stage mapping with average, range, and volume
- 1996Constructing volume-confirmed average-cross entries
- 1996Constructing four MFI bar states from range and volume
- 2001Building in-gear volume-price overlays
- 2004Constructing index volume for price-volume signals
- 2004Auditing volume-on-retest rules for prior highs and lows
- 2004Wait-rule collapse in a mistaken sale cascade
- 2005Constructing a volume and change weighted moving average
- 2005Daily average support and Friday volume holds
- 2007Match a volume-price oscillator to a range, not to a policy rebound
- 2008Volume confirms chart pattern breakouts
- 2011Color-coded volume bars for rule-based swing entries
- 2012Go or no-go checklist at repeated resistance
- 2012Pocket-pivot volume rules before a later breakout
- 2014Constructing defended price lines from volume spikes
- 2016Closing score from range location as a volume-checked sentiment filter
- 2019Volume follows price as auction state